FIGURE 4.
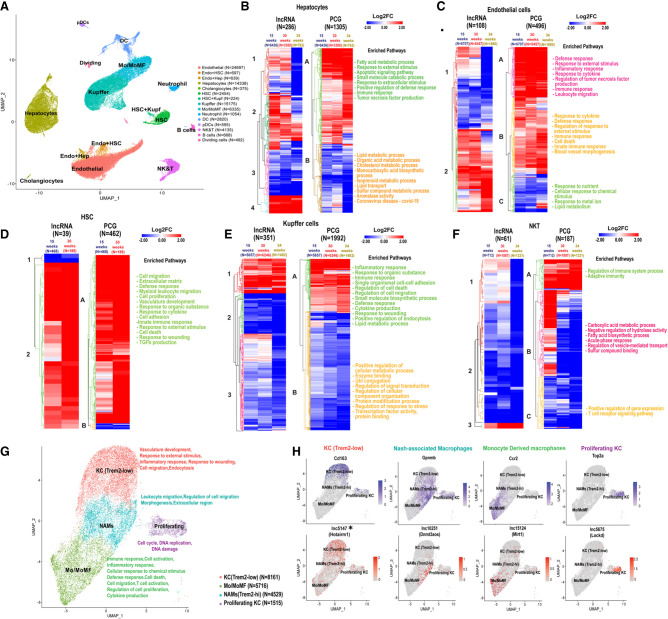
LncRNAs and PCGs perturbed across different cell types in NAFLD and NASH liver. (A) UMAP showing liver cell clusters for a total of 74,718 cells. Cells from healthy liver (19,364 cells) were aggregated with cells from livers of mice fed HFHFD for 15 wk (NAFLD liver; 23,961 cells), 30 wk (24,106 cells), or 34 wk (NASH livers; 7287 cells) (Supplemental Table S1H). Cell numbers in each cluster are shown in parentheses. Mo/MoMF, monocytes/monocyte-derived macrophages. (B–F) Heat maps showing differentially expressed lncRNAs and PCGs in the indicated cells clusters from 15-, 30-, and 34-wk HFHFD-fed livers compared to chow diet livers, in hepatocytes (B), endothelial cells (C), HSCs (D), Kupffer cells (E), and NK & T cells (F). Functional enrichment terms are shown at the right of each heatmap for each PCG heatmap subcluster (marked A–C) from each cell type. See Supplemental Table S4 for full data sets. (G) UMAP of Kupffer (macrophage) cell subpopulations, identified based on PCG markers in each cell subtype. Kupffer cells and Mo/MoMf cell clusters shown in A were reclustered to generate the four clusters shown at higher resolution, after filtering, to remove cells with high mitochondrial contamination. Functional enrichment terms of each cluster are shown at the right. (H) Feature plots showing expression of select PCG and lncRNAs marker genes in Kupffer cell subpopulations.

