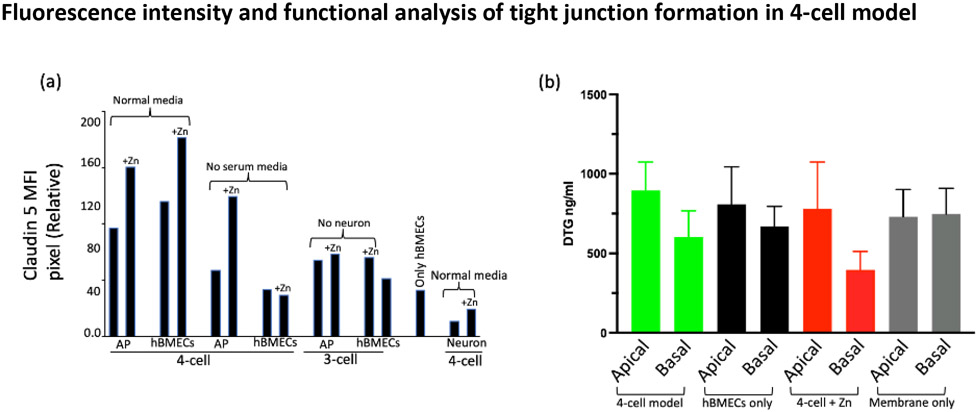
Figure 10.
Average fluorescence intensity analysis of claudin 5 for one representative corresponding to the image shown from the triplicate of BBB model types and drug penetration for different sets of BBB representation. (a) Cell surface pixel intensity for claudin 5 measured using FIJI ImageJ-win64 software and (b) evaluation of tight junction integrity and the penetration of HIV-ART drug DTG in the 4-cell model. The color-coded bar pairs show drug distribution in the apical and bottom layers of the indicated in-vitro models and control (membrane only) from a transwell membrane plate. Media from the apical and basal layer of the transwell membrane was collected after 48 hours of drug treatment. Data represent the mean concentrations from 3 replicates.
Abbreviations- MFI, mean fluorescence intensity; AP, astrocytes and pericytes; DTG, dolutegravir; hBMEC, Human brain microvascular endothelial cells; Zn, zinc

