
Figure 3.
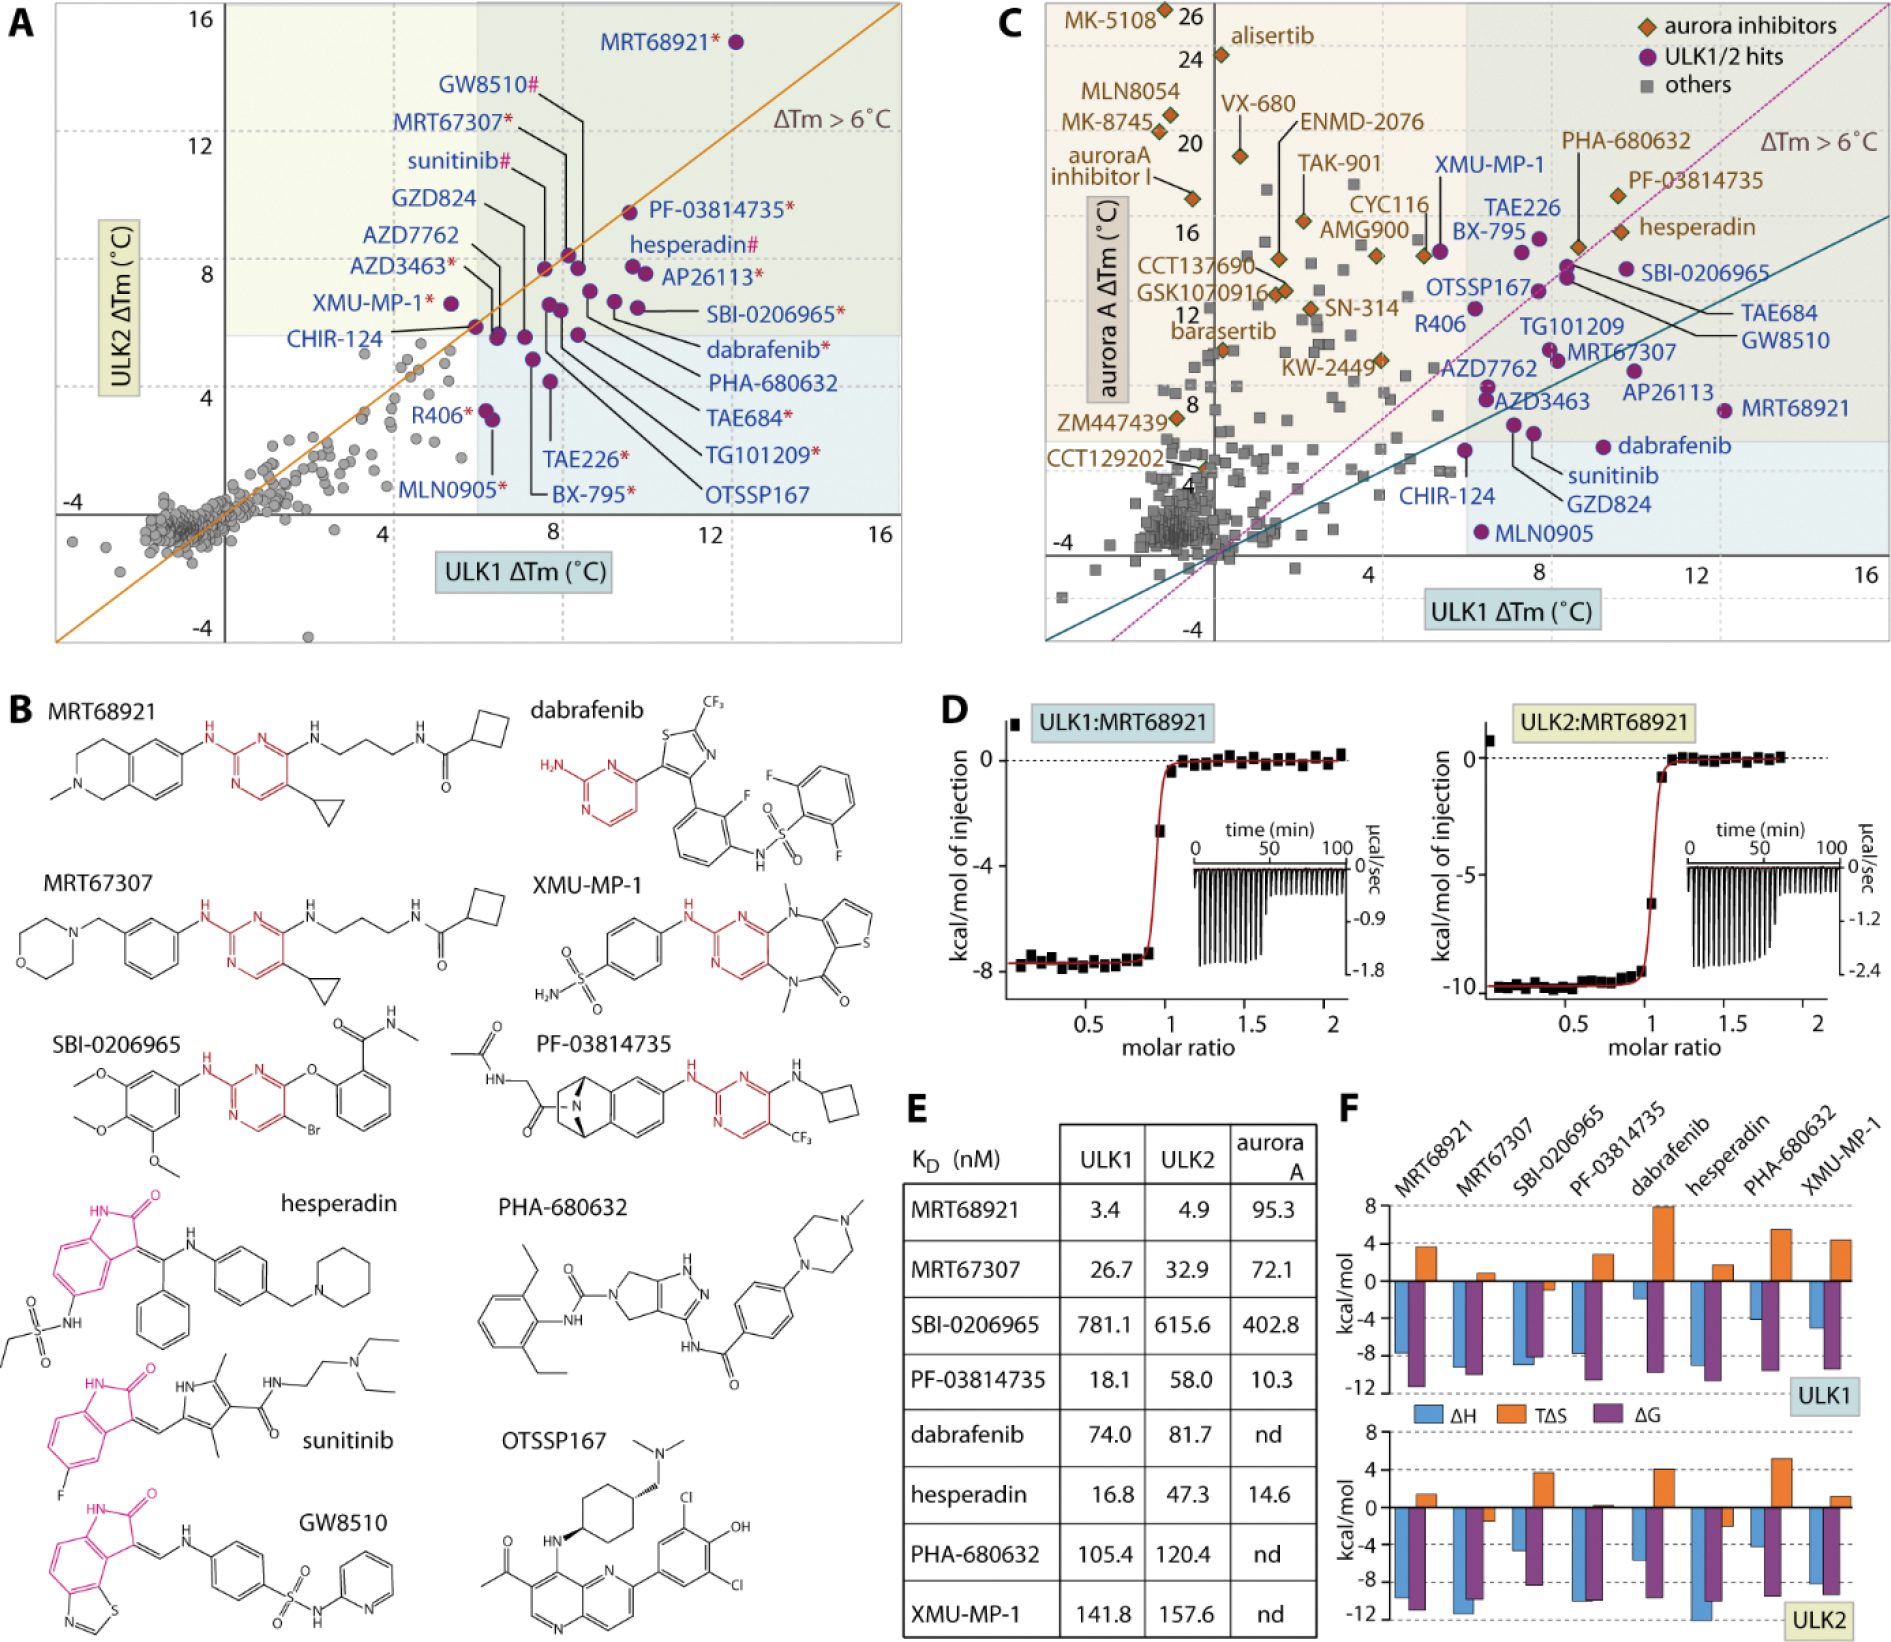
Inhibitor screening for ULK1 and ULK2. A) The plot of Tm shifts (ΔTm) of ULK1 against ULK2 for the set of 384 known kinase inhibitors demonstrates good correlation in inhibitor binding behavior for both kinases (orange, diagonal line indicates equal points on both axes, and the data are also summarized in Supplementary Table 1). The 22 hits with ΔTm more than 6 °C were grouped into three structural classes: 2-aminopyrimidine (indicated by *), 2-oxindole (#) and others (no symbol), of which example chemical structures of some inhibitors are shown in (B). C) Analyses of the ΔTm of ULK1 and Aurora A reveals common cross-activities of nearly all of ULK1 hits on Aurora A kinase, but not vice versa. The green diagonal line indicates equivalence of both values, while the magenta, dotted line intersects the highest and lowest points of both axes on the shown scales. D) Example ITC binding data for the interactions between MRT68921 with ULK1 and ULK2. The normalized heat of binding with the single-site binding fits (red line) are shown, while the raw isotherms of titration heat are displayed as insets. The binding affinities and the thermodynamics signatures from ITC for the selected set of compounds are shown in E) and F), respectively.