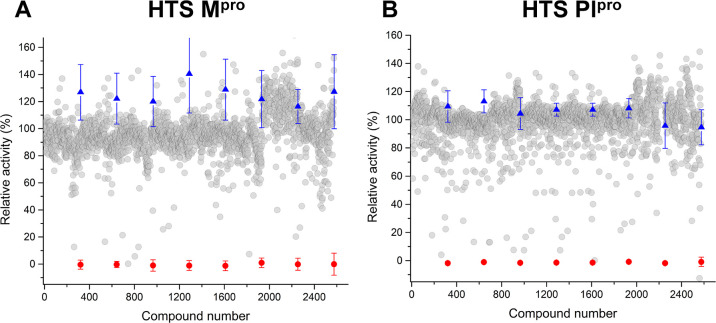
Figure 1.
Scatter plots showing the data from the high-throughput screening (HTS) against Mpro (A) and PLpro (B). Single-shot inhibition data are shown for compounds from the Microsource Spectrum collection containing 2560 compounds that were screened at 10 μM. Average Z = 0.76 ± 0.21 for Mpro and average Z = 0.67 ± 0.13 for PLpro. Compounds’ individual results are represented as gray spheres. Positive control averages are indicated as red spheres. Negative controls are indicated as blue triangles. Error bars are ± standard deviation from relative controls.

