
Fig. 8.
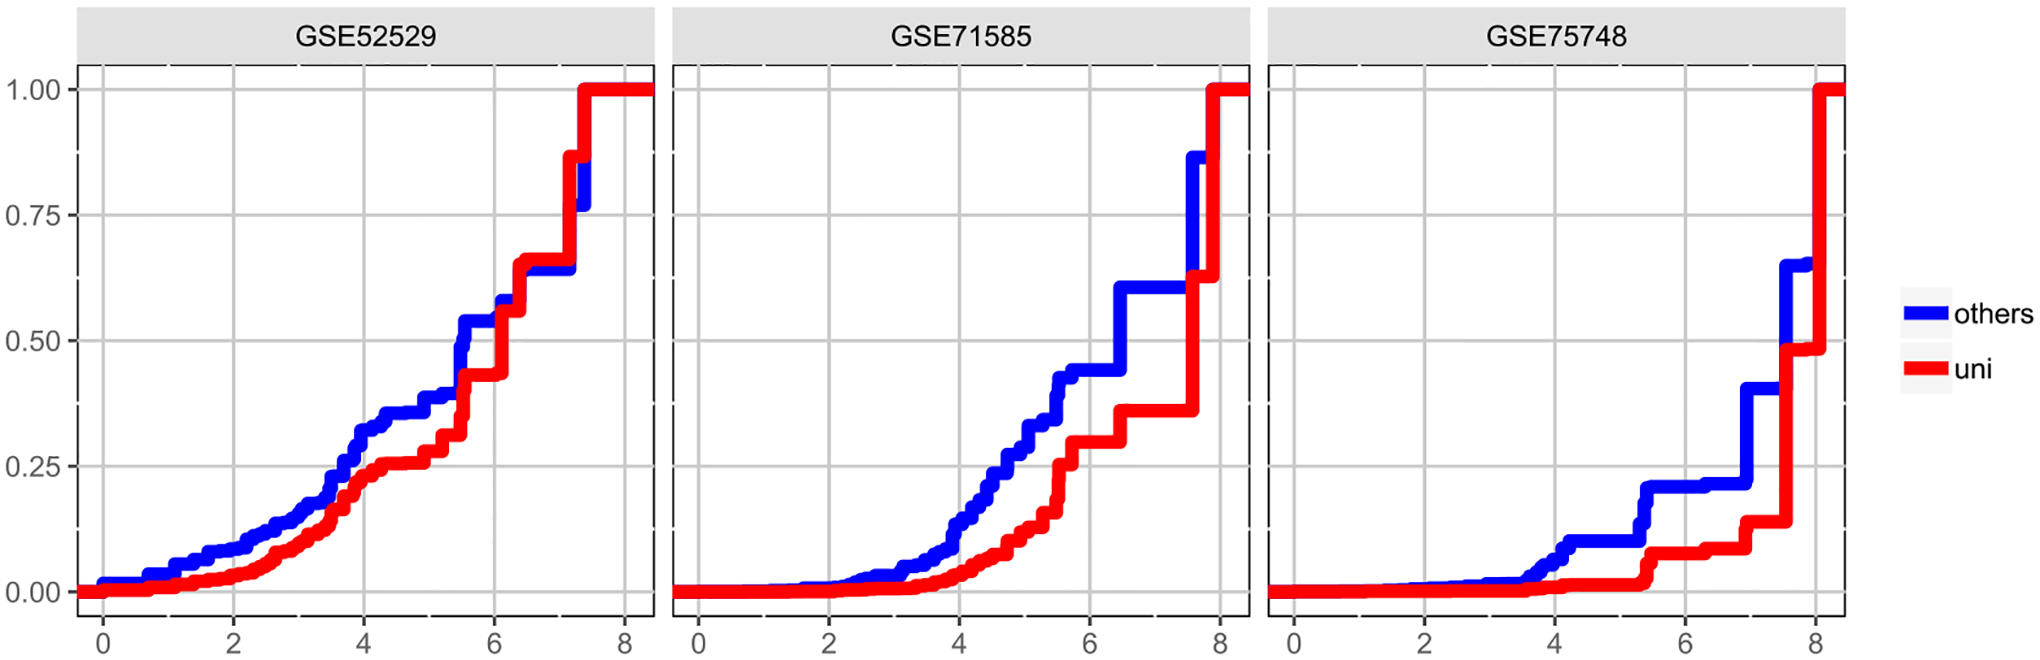
Genes are grouped by their pattern of differential expression across subtypes as inferred by the EBseq computation within scDDboost for three example datasets. Cumulative distribution functions of the log-scale size statistic for all genes identified by scDDboost are plotted; red is the subset uniquely identified by scDDboost; blue are those also identified by the comparison methods (MAST, scDD, or DESeq2). Sets of similarly-patterned genes tend to be larger (horizontal axis, log size) for genes uniquely identified by scDDboost (red) compared to other DD genes (blue), at 5% FDR.