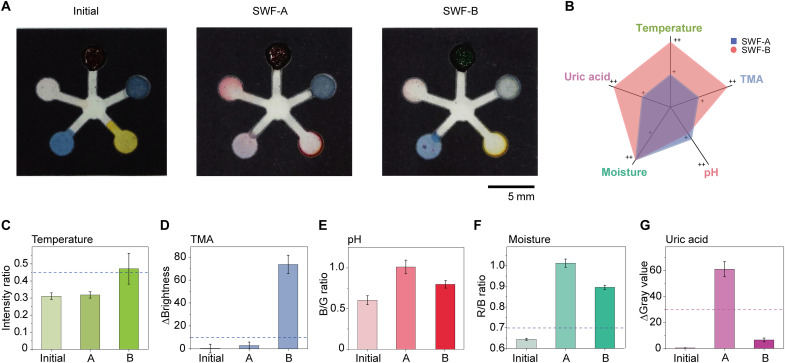
Fig. 3. Quantitative analysis of sensor patch responses to SWFs.
(A) Photos of the sensor patches before and after exposure to two types of SWFs. (B) Radial graph showing the different levels of the five markers in SWF-A and SWF-B. (C to G) Color analysis for the five parameters, respectively. The dashed line in each of the bar figures is the cutoff values differentiating condition A versus B. (C) Intensity ratio increases above the dashed line means the change in temperature is greater than 1°C, indicating wound infection. (D) ΔBrightness increases above the dashed line indicate sufficient TMA formation above 300 ppm and wound infection. (E) The pH sensor indicates the pH values of both SWFs are in the neutral range when compared to calibration line in Fig. 2. (F) The R/B ratio rises above the baseline fluctuation of 0.6 as SWF enters the fourth detection. A value of 0.7 is selected as the threshold to indicate that the moisture level has reached ~50% and sufficient exudate has reached the patch. (G) ΔGray value drops below the dashed line, meaning that the UA concentration has decreased at least 50% with respect to SWF-A, indicating possible prolonged inflammation or wound infection. All error bars in (C) to (G) represent the SD from three replicates.

