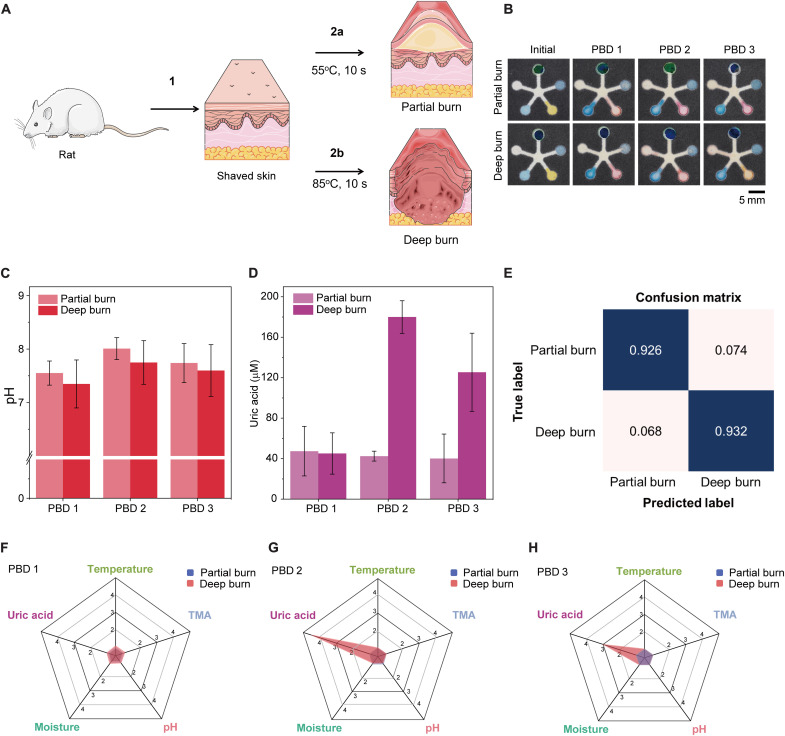
Fig. 5. Ex situ analysis of rat burn wound exudate on benchtop.
(A) A schematic drawing showing the creation of partial burn versus deep burn. (B) Sensor images showing initial colors before burn wound exudate addition and after addition of wound exudate collected from rat partial versus deep burn from 24 hours after burn creation [post-burn day (PBD)] 1 to PBD 3. Quantitative analysis of (C) pH trend and (D) UA concentration changes over 3 days. Error bars in (C) and (D) represent the SD testing burn wound exudate from three rats. (E) Confusion matrix for burn wound severity. (F to H) The radial graphs for an overview of the five markers on (F) PBD 1, (G) PBD 2, and (H) PBD 3.

