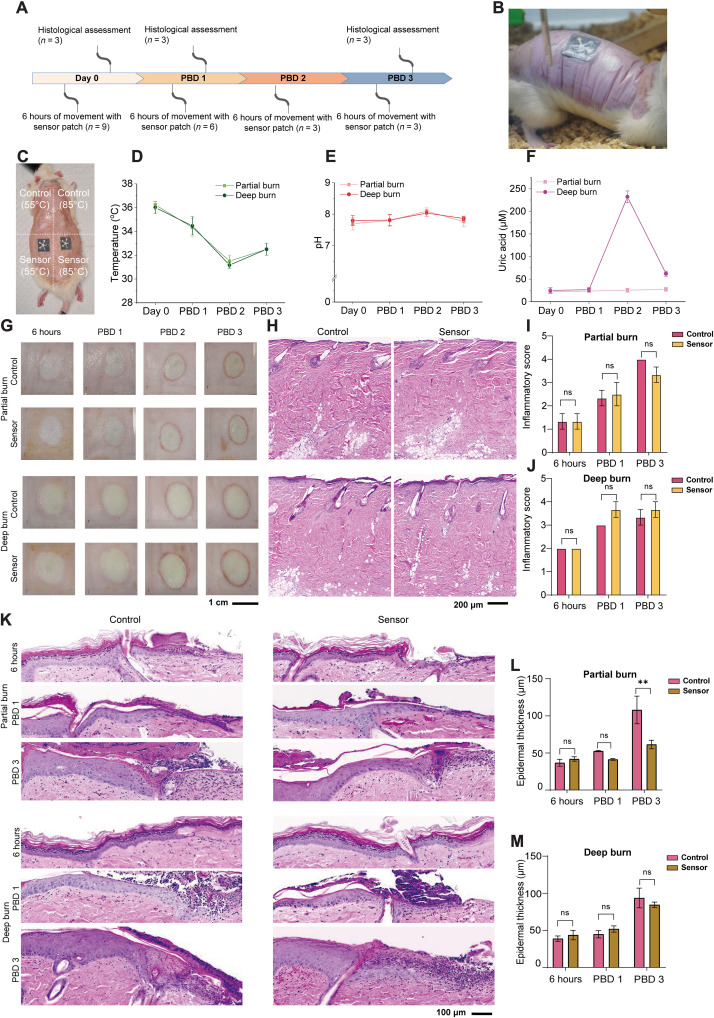
Fig. 6. In situ monitoring of burn wounds and sensor patch biocompatibility in rat burn wound models.
(A) In situ wound monitoring study design. (B) Photograph showing the sensor patches worn on a freely moving rat. (C) Photograph showing the burn wounds and the experimental arrangement of the sensor patch attachment, i.e., the sensor patches are placed at the bottom row, whereas the top two burn wounds are used as controls. Quantitative comparison of (D) temperature, (E) pH, and (F) UA for the partial burns versus the deep burns. (G) Macroscopic images of the burn wounds from day 0 to PBD 3. (H) Hematoxylin and eosin (H&E) images of the burn wounds without sensor (control) versus with sensor on PBD 1. The statistical comparison of inflammatory scores for (I) partial burn and (J) deep burn for day 0, PBD 1, and PBD 3. (K) H&E images showing the wound edge epithelial region for control versus sensor attached burn wound. The statistical comparison of epithelial thickness for (L) partial burn and (M) deep burn for day 0, PBD 1, and PBD 3. Data are presented as mean values ± SEM. Statistical comparisons were made using two-way analysis of variance (ANOVA) with post hoc Sidak’s test (**P < 0.01, n = 3). ns, not significant.

