. 2023 Jun 1;12:e79840. doi: 10.7554/eLife.79840

Figure 1. Identification of PRRX1 as a transcription factor reactivated in IPF lung.

(A) Venn diagram showing the number of genes up-regulated in three IPF lung Transcript microarray databases compared to controls (NCBI GEO GDS1252, GDS4279, GDS3951). Among the 210 common upregulated genes in all three datasets, 12 genes were annotated as transcription factors (see embedded table in the figure, PRRX1 is in bold). (B) Dot plots with median showing the mRNA expression of PRRX1a and PRRX1b isoforms in control (circle, n=32) and IPF (square, n=37) whole lung homogenates. (C) Immunoblot showing PRRX1 expression in control and IPF whole lung homogenates. ACTB was used as loading control. The quantification of PRRX1 relative expression to ACTB in control (circle, n=11) and IPF (square, n=12) is displayed as dot plot with median on the right. (D) Representative immunohistochemistry images (n=5 per group) showing PRRX1 staining (red) in control (left panels) and IPF (right panels). Nuclei were counterstained with hematoxylin. Note the absence of PRRX1 staining in the alveolar and bronchiolar epithelium (arrow head). PRRX1-positive cells were only detected in the peri-bronchiolar and peri-vascular spaces (arrows) in control lungs (left panels). In IPF, PRRX1-positive cells (arrow) were detected in the remodeled/fibrotic area (right panels). Note that epithelial cells (arrow head) and bronchiolar smooth muscle cells (dashed areas) are PRRX1 negative. The high-magnification pictures match the dashed boxes displayed in the main panels. Scale bar: 80 µm in low magnification images and 25 µm in high-magnification ones. Abbreviations: epithelium. (epith); bronchiolar. (bronch); Hyperpl. (hyperplastic). Mann Whitney U test, *p≤0.05, **p≤0.01.

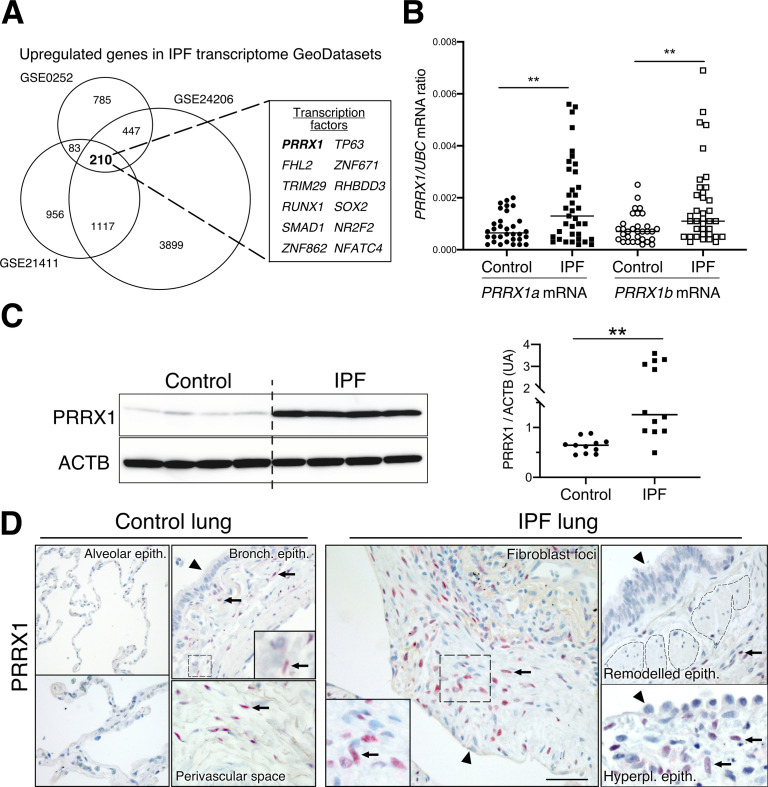
Figure 1—source data 1. The zip folder contains the data presented in panels B-C (in an Excel document).
Labelled (.pdf) and raw (folder) blot images showed in panel C are also included.

Figure 1.

Figure 1—figure supplement 1. Co-expression of PRRX1 with Vimentin and ACTA2 in control and IPF lungs by immunochemistry.

Figure 1—figure supplement 1.

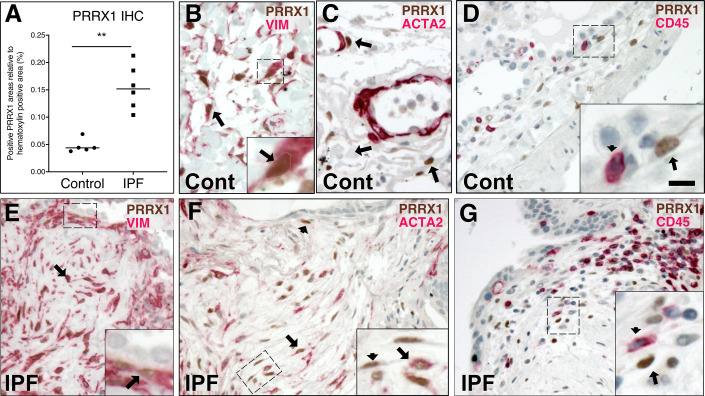
(A) Dot plots with median showing the percentage of PRRX1-positive area relative to hematoxylin area (used as total nuclear area) in control (circle, n=5) and IPF (square, n=6) lung paraffin sections by immunocytochemistry (see Figure 1D). (B–D) Representative immunohistochemistry images (n=3 per group) in control lung showing PRRX1 staining (Brown Chromogen, nuclear staining) in perivascular space with (B) Vimentin (Red chromogen), (C) ACTA2 (Red chromogen) and (D) CD45 (Red chromogen). Note that PRRX1-positive cells (arrow) were Vimentine positive (B) but ACTA2 (C) and CD45 negative (D). Insert in (B): high magnification of the black dashed box in the main left panel showing a double positive PRRX1 (brown nuclear staining, outlined with dashed white line) and Vimentin (red cytoplasmic staining) cell. Insert in (D): high magnification of the black dashed box in the main bottom panel showing a PRRX1 (brown nuclear staining) positive but CD45-negative cell (arrow) as well as a CD45 (red cytoplasmic staining) positive but PRRX1-negative cell (arrowhead). (E–G) Representative immunohistochemistry images (n=3 per group) showing PRRX1 staining (Brown Chromogen, nuclear staining) in IPF fibroblast foci with (E) Vimentin (Red chromogen), (F) ACTA2 (Red chromogen) and (G) CD45 (Red chromogen). Note that PRRX1-positive cells were Vimentin positive (see black arrow in (E)) but only some were ACTA2 positive (arrow and dashed box in (F)). PRRX1pos ACTA2neg cells were also present (see arrowhead in (F)). All PRRX1pos cell populations were also CD45 negative (G). Insert in (E): high magnification of the black dashed box in the main left panel showing a double positive PRRX1 (brown nuclear staining, see black arrow) and Vimentin (red cytoplasmic staining) cells. Note that the epithelium is negative for both markers. Panel in (F): high magnification of the black dashed box in the main right panel showing a double positive PRRX1 (brown nuclear staining, see black arrow) and ACTA2 (red cytoplasmic staining) cell. PRRX1pos ACTA2neg cells were also present (see arrowhead). Panel in (G): high magnification of the black dashed box in main panel (G) showing a PRRX1 (brown nuclear staining) positive but CD45-negative cell (arrow) and a CD45pos (red cytoplasmic staining) positive but PRRX1neg cell (arrowhead). Nuclei were counterstained with hematoxylin in all panels. Abbreviations: Vim (Vimentin), Pos (positive), neg (negative). (Scale bar: 50 µm in (B–C), 80 μm in (D) and 25 µm in high magnification (B and D); 80 µm in (E–G) and 40 µm in high magnification (E–G)).
Figure 1—figure supplement 1—source data 1. The zip folder contains the data presented in the panel A (in an Excel document).