Figure 2.
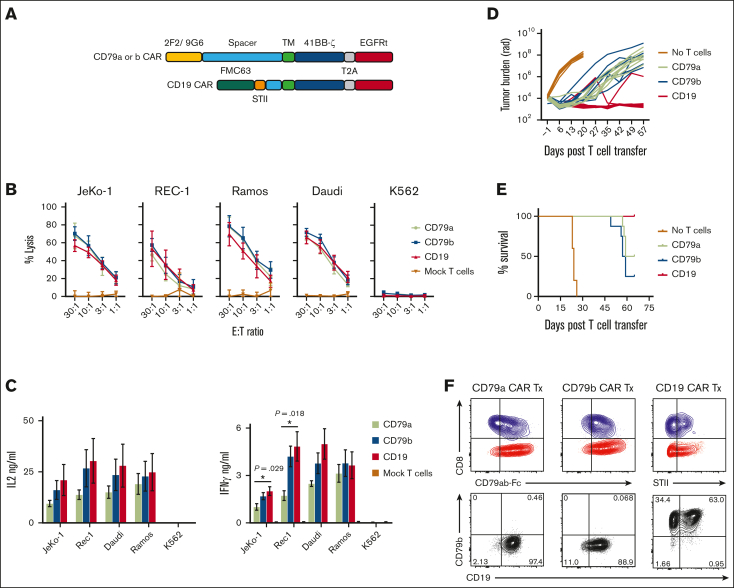
CD79a and CD79b CAR T cells are functional in vitro and in vivo. (A) Schematic of CD19, CD79a, or CD79b CAR constructs. (B) Lysis of indicated tumor cell lines by chromium release assay. Data are means ± SEM from 3 independent experiments. (C) CAR T-cell IL-2 or IFN-γ production measured by ELISA. Data are means ± SEM from 4 independent experiments. P values were calculated with one-way ANOVA with post hoc Tukey multiple comparisons test. (D-E) NSG mice were inoculated with JeKo-1 ffluc tumor cells and either left untreated or treated at day 7 with a total of 2 × 10⁶ of CD79a, CD79b, or CD19 CAR T cells (CD4:CD8 at 1:1 ratio). (D) Bioluminescent imaging of tumor bearing mice at indicated time points. Each line represents measurements of a single mouse in each of the treatment groups. (E) Survival of mice from 2 independent experiments, each containing 5 to 8 mice per group. (F) Representative flow cytometric analysis of T cells and tumor cells in BM suspensions from JeKo-1 tumor bearing mice treated with CD79a, CD79b, or CD19 CAR T cells on the day that mice met criteria for euthanasia. Top panels were gated on singlets, live cells, and CD45+CD8+ (blue) or CD45+CD4+ (red) population. CAR staining was measured by CD79ab-Fc or anti-STII antibody binding. Bottom panels were gated on singlets, live cells, and CD45+GFP+ Jeko-1 ffluc cells. ANOVA, analysis of variance; ELISA, enzyme-linked immunosorbent assay; SEM, standard error of the mean; TM, transmembrane domain.

