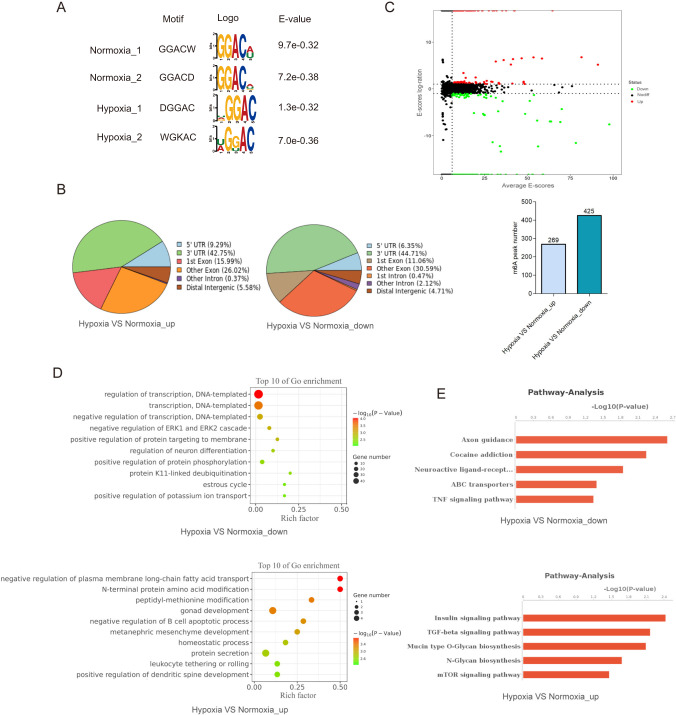
Fig. 2. Transcriptome-wide m6A landscape under hypoxic conditions.
A The top enriched motifs within m6A peaks in PANC-1 cells under either normoxic (20% O2) or hypoxic (1% O2) conditions. B Pie charts showing the m6A peak distribution in different RNA regions (CDS, 5′UTR, 3′UTR and stop codon) in PANC-1 cells under normoxia or hypoxia. C MAplot showing the numbers of m6A peaks under hypoxic (1% O2) or normoxic (20% O2) conditions. D GO enrichment map of differentially expressed m6A-containing genes between hypoxic and normoxic PANC-1 cells. E KEGG pathway analysis of m6A-hypo or m6A-hyper genes in response to hypoxia (1% O2).

