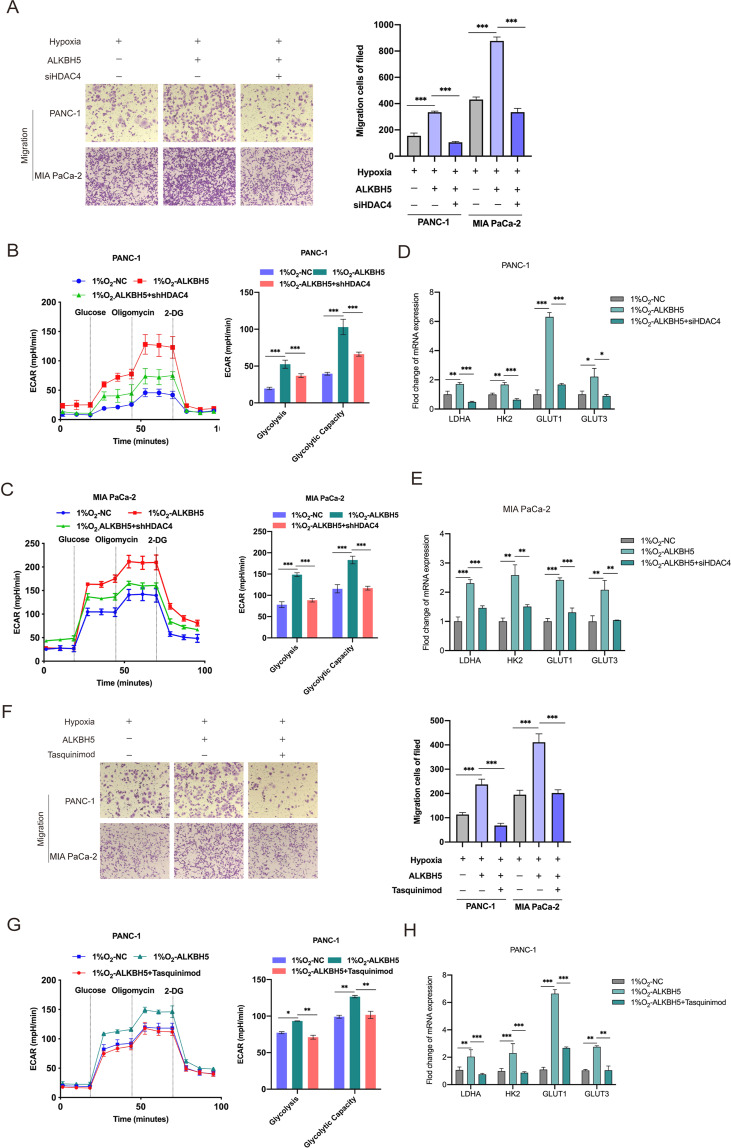
Fig. 6. HDAC4 blockade reversed the effects of hypoxia in an m6A dependent manner.
A ALKBH5-overexpressing PC cells transfected with the shNC or sh-HDAC4 were incubated under hypoxic conditions. Transwell assay was used to investigate the cell migration abilities. B, C ALKBH5-overexpressing PC cells transfected with the shNC or sh-HDAC4 were cultured under hypoxic conditions. The ECAR was measured to determine the glycolytic metabolism of treatment cells. Glycolytic variations (right) of glycolysis and glycolytic capacity were summarized from raw data. The metabolic inhibitors were injected sequentially at different time points as indicated. n = 3-4 for each treatment group. D, E ALKBH5-overexpressing PC cells transfected with the shNC or sh-HDAC4 were incubated under hypoxic conditions. The expression of a panel of glucose metabolism-related genes was detected by qRT-PCR. Error bars are mean ± SEM. (n = 3). F ALKBH5-overexpressing PANC-1 and MIA PaCa-2 cells treated with Tasquinimod under hypoxic conditions. The cell migration ability was assessed by Transwell assay. G ALKBH5-overexpressing PANC-1 and MIA PaCa-2 cells treated with Tasquinimod under hypoxic conditions. The glycolytic metabolism of treatment cells was measured by Seahorse XF24 system. Glycolytic variations (right) of glycolysis and glycolytic capacity were summarized from raw data. The metabolic inhibitors were injected sequentially at different time points as indicated. n = 3-4 for each treatment group. H The expression of a panel of glucose metabolism-related genes in PANC-1 and MIA PaCa-2 cells was detected by qRT-PCR. Error bars are mean ± SEM. (n = 3). *P < 0.05, **P < 0.01, ***P < 0.001 and ns not significant.

