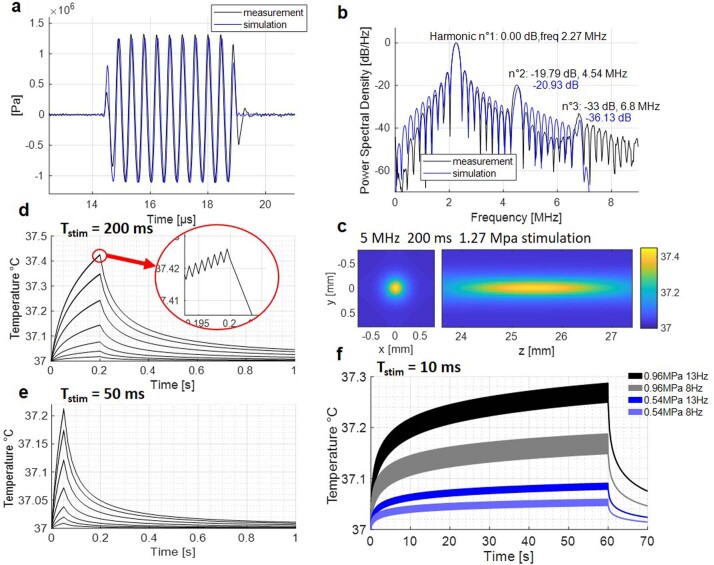
Extended Data Fig. 4. Simulated acoustic fields and temperature increases.
(a) Comparison between a water tank measurement at the focus with a calibrated hydrophone (black) obtained with the 2.25 MHz transducer and reaching -1.11 MPa peak negative pressure, and a simulated waveform at the focus (blue) reaching the same negative pressure. The two waveforms match very well (0.42% error) ensuring a good match between our simulation setup and physical parameters. (b) Power spectral density of the measured (black) and simulated (blue) waveforms, showing that simulations can be used to estimate the importance of non-linear propagation. A second harmonic 20 dB below the fundamental indicates a factor of 100 in terms of energy, meaning that absorption can be calculated in a linear approximation. (c-f) Thermal simulations are performed in a two-fold process corresponding to a worst-case scenario (see methods): propagation in a water medium, and thermal absorption in a brain-mimicking medium. (h) 3D temperature map at the end of a 200 ms stimulation (at 15 MHz and 1.27 MPa). (d) Temperature rise at the focus for a 15 MHz 200 ms stimulation with the 7 pressures used in Fig. 1I (0.26, 0.39, 0.54, 0.74, 0.96, 1.15, 1.27 MPa). A zoom on the increasing curve reveals the fluctuations due to the 1 kHz on-off cycles. (e) Temperature rise at the focus for a 15 MHz 50 ms stimulation with the same 7 pressures. (f) Temperature rise at the focus for 15 MHz 10 ms stimulations (1 kHz modulation) at a repetition rate of 8 Hz and 13 Hz (used in Fig. 3o), for focus pressures of 0.96 MPa and 0.54 MPa.

