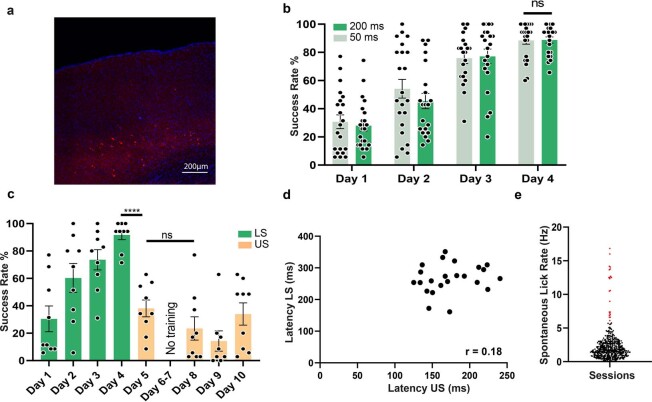
Extended Data Fig. 6. MscL G22S expression with the US and light-associative training in mice.
(a) Confocal stack projection of a sagittal brain slice expressing MscL G22s-tdTomato (red) and labeled with DAPI (blue). Similar results have been obtained on N = 3 animals. (b) Head-fixed and water-restricted mice were trained for four days to respond to a full-field stimulation of one eye (200 and 50 ms) that preceded a water reward. Mice responded by licking before (anticipation — successful trial) or after the delivery of water (failure). The mean success rate increased progressively and mice learned the task (upon 50 ms and 200 ms light stimulation) after four days of training (ns p = 0.9387, two-tailed unpaired t test, Mean: 27.9, 45.4, 77.1, 88.8, SD: 17.4, 24.8, 23.6, 10.4% for 200 ms, Mean: 30.7, 54.2, 75.9, 88.5, SD: 22.2, 31.0, 17.5, 12.8% for 50 ms). (c) Mean rates of successful trials in non-transfected (NT) mice for 4 days of training with light stimulation (50 ms, LS green) and for 4 days of US stimulation (US orange) (Between Day 4 LS and Day 5 US: 50 ms 1.2 MPa, ****, p = 0.0000047, two-tailed unpaired t test. Between Day 5 US and Day 8 US: 50 ms 1.2 MPa, ns, p = 0.1850. Mean: 30.5, 60.3, 73.6, 91.7, 38.1, 23.5, 14.3, 34.0, SD: 28.2, 31.6, 22.1, 10.3, 18.5, 25.5, 21.1, 24.4 %). (d) Pearson correlation scatter plot for time to first lick after either light (LS) or US stimulation. (e) Identification and exclusion of outlier sessions (in red) based on the ROUT method, (Q = 1%) for the session spontaneous lick rate measured on a 1 s time window prior to all trials of the session e Q1 = 0.9 Hz, Median = 1.7 Hz, Q3 = 2.8 Hz, Mean= 2.3 Hz, SD = 2.3 Hz. Data are presented as mean values + /- SEM.

