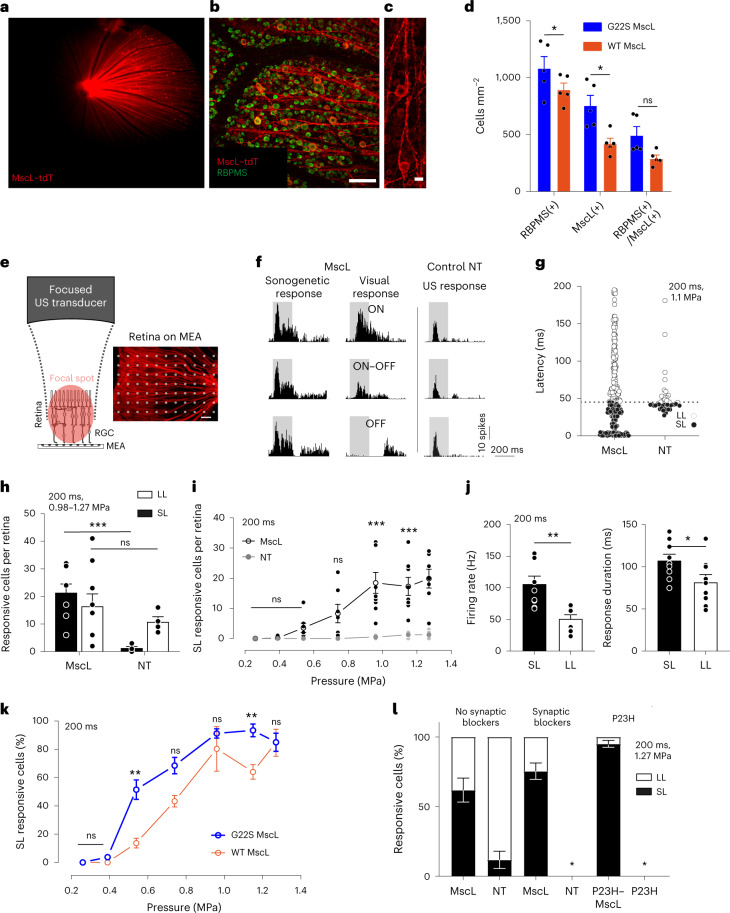
Fig. 2. Sonogenetic therapy in rat RGCs.
a, In vivo retinal fundus image showing MscL–tdTomato expression. b,c, Confocal stack projections across the RGC layer of a flat-mounted retina. d, Density of RBPMS-positive, MscL-positive and double-labelled cells (n = 5 WT MscL and G22S MscL retinas; *p = 0.0140, for RBPMS(+); *p = 0.0465 for RBPMS(+)/MscL(+), unpaired two-tailed t-test). e, Schematic of the experimental setup with an image of the retina on MEA electrodes. f, Representative peristimulus time histograms (PSTHs) for US or visual stimuli in MscL-transfected or NT RGCs (US stimuli, 15 MHz at 1.27 MPa). g, RGC response latencies to a 15 MHz US stimulus for MscL (n = 300 cells, 9 retinas) and NT retinas (n = 41 cells, 4 retinas). Dotted line, 45 ms latency threshold. h, Numbers of cells per retina responding to 15 MHz US stimuli (0.98–1.27 MPa) for MscL (n = 9 retinas) and NT (n = 4 retinas) with SL (<45 ms) or LL (>45 ms). *p = 0.0002, unpaired two-tailed t-test. i, Mean numbers of SL-responding RGCs per retina following stimulation with US stimuli of increasing pressures for MscL (n = 9) and NT (n = 4) retinas. ***p = 0.00008, ***p = 0.0010, ***p = 0.0008, multiple unpaired two-tailed t-tests. j, Maximum firing rates and response durations (SL and LL RGCs from MscL retinas in response to US stimuli of increasing pressures (0.20–1.27 MPa)) (n = 9 retinas, **p = 0.0017, *p = 0.0418, unpaired two-tailed t-test). k, Percentages of SL RGC cells (normalized against the maximum number of responsive cells in each experiment) responding to US stimuli for WT MscL (n = 3 retinas) and G22S MscL (n = 6 retinas) retinas. **p = 0.0065, **p = 0.0083, multiple unpaired two-tailed t-tests. l, Ratios of RGCs responding to US stimulation with SL or LL for MscL and NT retinas (n = 9 retinas for MscL and 4 retinas for NT), following the application of a cocktail of synaptic blockers (CNQX-CPP-LAP4, n = 3 retinas for both MscL and NT) and for P23H retinas with and without MscL expression (for both, n = 3 retinas). *Conditions with no US-elicited cell responses. Data are presented as mean values ± standard error of the mean (s.e.m.). Scale bars, 100 μm (b), 20 μm (c), 200 μm (e).

