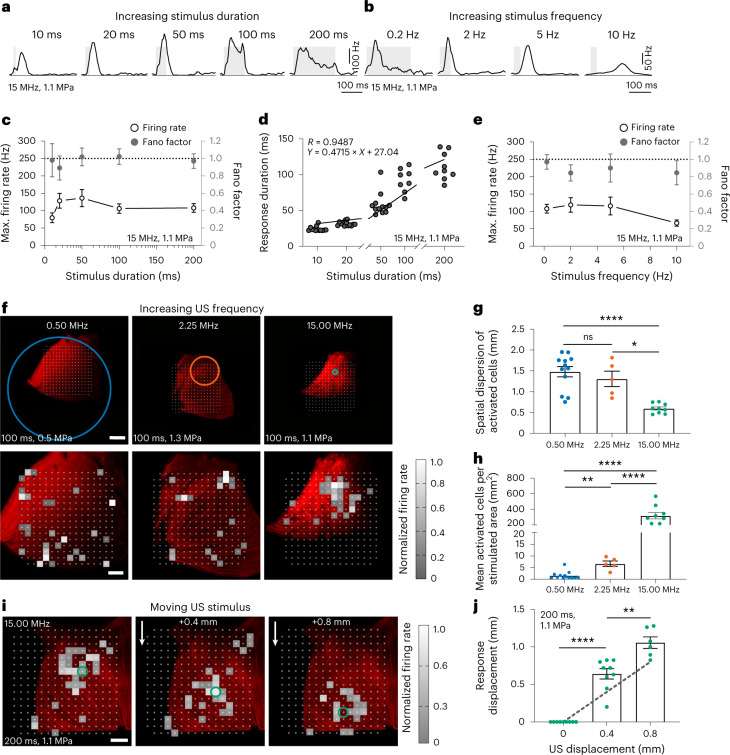
Fig. 3. Spatiotemporal properties of sonogenetic retinal responses.
a,b, Spike density functions of two RGCs from the MscL retina for 15 MHz stimulus durations and repetition frequencies (0.5 Hz repetition rate (a); 10, 20, 50 and 200 ms durations (b)). c, Maximum firing rates for different 15 MHz stimulus durations and mean Fano factor values for all the cells (10–20 ms, n = 8 retinas; 50–200 ms, n = 9 retinas). d, Correlation between response duration and stimulus duration (n = 9 retinas). e, Maximum firing rates for different stimulus repetition frequencies and mean Fano factor values for all the cells (0.2–2.0 Hz, n = 9 retinas; 5.0–10.0 Hz, n = 8 retinas). f, Retinas on an MEA chip and the corresponding size of the incident US pressure beam (the circles represent the FWHM and are centred on the estimated centre of the response) for 0.50, 2.25 and 15.00 MHz (top). The corresponding activation maps representing the normalized firing rates of the cells following US stimulation (bottom). Each square box represents an electrode with at least one US-activated cell. g,h, Spatial dispersions of activated cells (g) and ratios of the number of activated cells to the stimulated area for the three US frequencies (h); ****p = 0.00002 (g), p = 0.00006 (15.00 versus 2.25 MHz) and p = 0.00005 (15.00 versus 0.50 MHz) (h); **p = 0.0008, *p = 0.0169, unpaired two-tailed t-test. Here n = 12 retinas for 0.50 MHz (0.29–0.68 MPa), n = 5 retinas for 2.25 MHz (1.11–1.62 MPa) and n = 9 retinas for 15.00 MHz (1.12–1.27 MPa). i, Heat maps showing activated cells in the MscL retina following displacements (0.4 and 0.8 mm) of the US transducer. The circles represent the estimated centre of the response. j, Relative displacements of the centre of the response following the displacement of the 15 MHz US transducer. ****p = 0.00001, **p = 0.0018, unpaired two-tailed t-test. Here n = 9, 9 and 6 positions for 4, 4 and 2 retinas for displacements of 0, 0.40 ± 0.20 and 0.80 ± 0.18 mm (s.d.), respectively. The grey dotted line represents the theoretical displacement. Data are presented as mean values ± s.e.m. Scale bars, 1.0 mm (f, top); 0.5 mm (f (bottom) and i).

