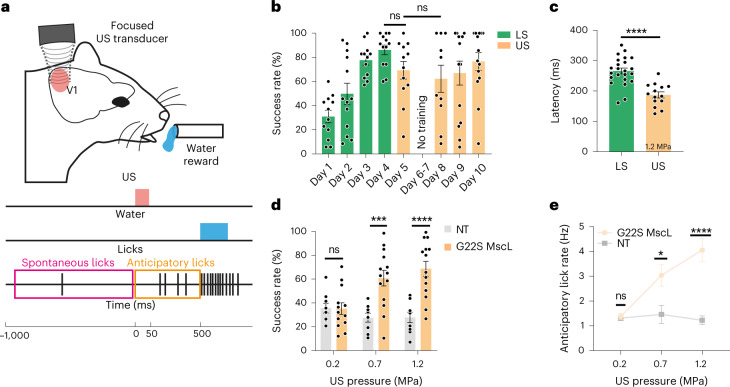
Fig. 6. Behavioural response induced by the sonogenetic activation of the V1 cortex in mice following associative visual training.
a, Schematic of the behavioural task performed by mice. Water-restricted animals trained in an associative learning paradigm for light stimulation (LS) with a water reward are subjected to either an LS of the eye (days 1–4) or the US stimulation of V1 at 15 MHz (days 5 and 8–10). b, Mean rates of successful trials for 4 days of training during the learning of association between LS (green, 50 ms) and water reward followed by US stimulation (orange, 1.2 MPa) for G22S MscL-transfected mice (between day 4 of LS and day 5 of US; 50 ms at 1.2 MPa; ns, p = 0.0570). Between day 5 of US and day 8 of US, 50 ms at 1.2 MPa; ns, p = 0.6079, two-tailed unpaired t-test; mean, 30.9%, 49.9%, 77.6%, 86.2%, 69.3%, 62.3%, 66.9%, 76.5%; s.d., 17.9%, 31.2%, 13.9%, 14.1%, 25.4%, 35.4%, 37.1%, 27.7%; n = 14 animals. c, Mean times to first lick after light (50 ms) and US stimulation (50 ms at 1.2 MPa) (****p = 0.0000290, two-tailed unpaired t-test, n = 23 and n = 14 animals; mean, 265.9, 187.1 ms and s.d., 46.5, 37.3 ms for LS and US, respectively). d, Mean rates of successful trials over 4 days of US stimulation for NT and G22S MscL-transfected mice, following 50 ms of US stimulation at increasing US pressures (ns p = 0.9452, ***p = 0.0003, ****p = 0.0000296, two-tailed unpaired t-test, for 0.2, 0.7 and 1.2 MPa, respectively; n = 14 animals; mean, 35.2%, 60.8%, 68.7% and s.d., 17.5%, 24.4%, 23.6% for G22S MscL; n = 9 animals; mean, 35.7%, 27.5%, 27.8% and s.d., 12.4%, 11.0%, 13.2% for NT). e, Session anticipatory lick rates for NT and G22S MscL-transfected mice at increasing US pressures (ns p = 0.6934, *p = 0.0119, ****p = 0.0000340, two-tailed unpaired t-test, for 0.2, 0.7 and 1.2 MPa, respectively; n = 14 animals; mean: 1.4, 3.0, 4.1 and s.d., 0.4, 1.7, 1.8 Hz for G22S MscL and n = 9 animals; mean, 1.3, 1.4, 1.2 and s.d., 0.3, 1.1, 0.5 Hz for NT). Data are presented as mean values ± s.e.m.

