
Fig. 2. Differentially expressed genes in nasal mucosa of fatal COVID-19 outbreak cases as compared to matched PCR-positive residents from three nursing homes.
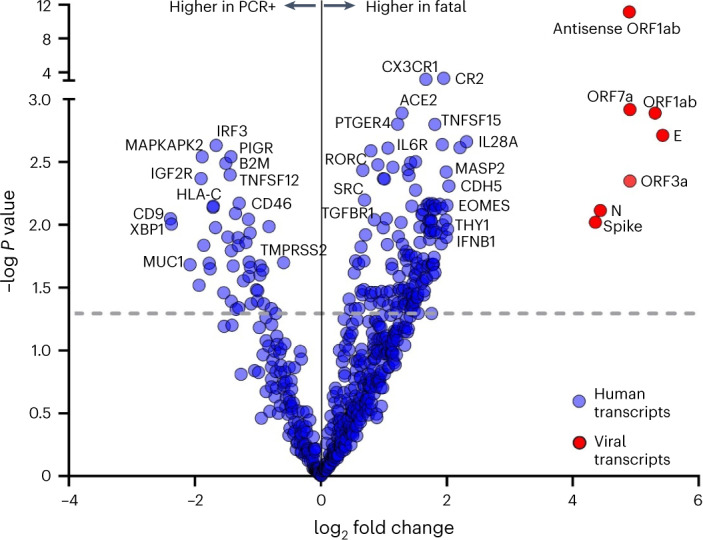
Volcano plot of differentially expressed genes in nasal mucosa of fatal (n = 20) versus age-matched, sex-matched and outbreak-matched non-fatal PCR-positive cases (n = 30), quantified by nCounter digital transcriptomics (uncorrected P values from linear model, negative binomial distribution, dotted line showing P < 0.05, FDR q values provided in Source Data). Selected viral (red circles) and host immune transcripts (blue circles) significantly upregulated or downregulated in fatal versus non-fatal cases are highlighted with gene names. Details on immune genes are given in the Results section. PCR+, PCR positive.