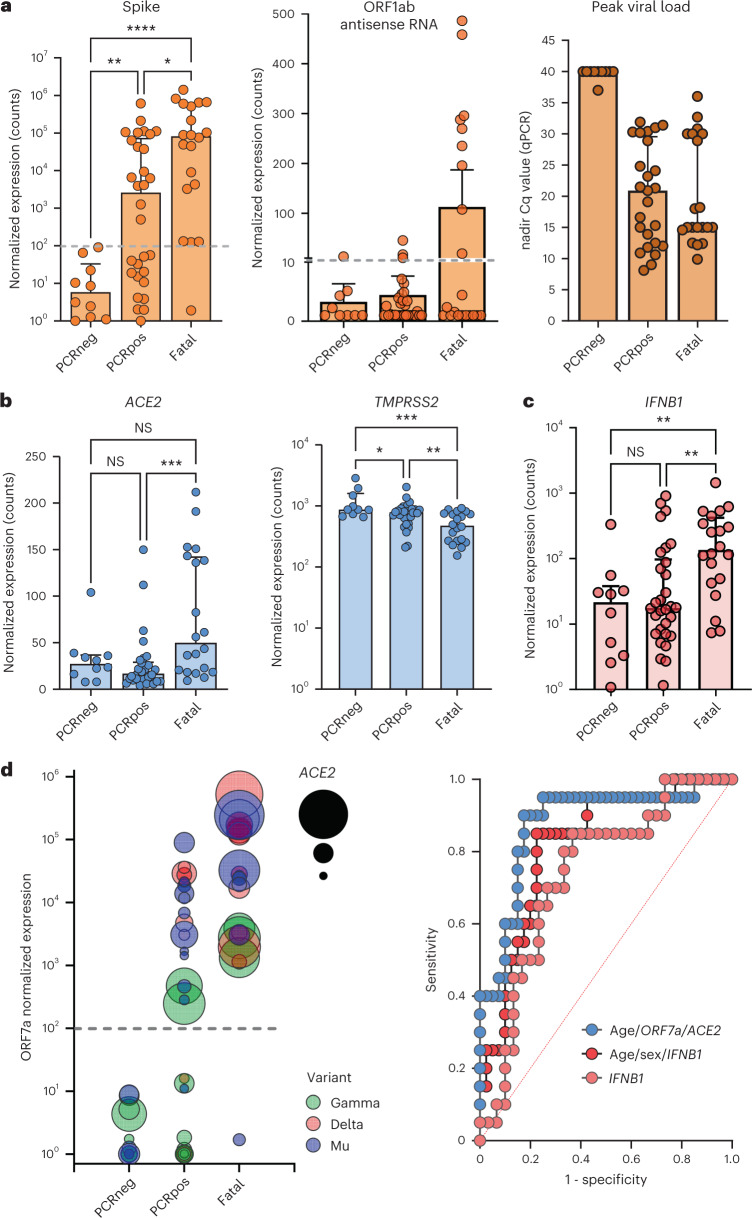
Fig. 3. Immunological and virological risk factors identified in fatal COVID-19 outbreak cases among residents in three nursing homes.
a–c, Viral transcript levels for spike protein (left: fatal versus PCRpos P = 0.012, fatal versus PCRneg P = 0.000022, PCRneg versus PCRpos P = 0.0089) and ORF1ab antisense RNA (middle), measured by nCounter digital transcriptomics. Right panel shows peak viral load (nadir Cq values) as quantified by qPCR. Viral receptors (ACE2: fatal versus PCRpos P = 0.0009; TMPRSS2: fatal versus PCRpos P = 0.0036, fatal versus PCRneg P = 0.0005, PCRneg versus PCRpos P = 0.0422) (b) and antiviral cytokine IFNB1 (fatal versus PCRpos P = 0.0022, fatal versus PCRneg P = 0.0022) (c) were quantified by nCounter digital transcriptomics. Data are presented as median values ± s.d. d, Left: visualization of best predictive model (multivariate logistic regression, selected by cAIC), including age (not depicted) and ORF7a and ACE2 transcripts. Dashed gray lines indicate the detection limit of SARS-CoV-2 transcripts. Each circle represents a resident, and the size of the circle is proportional to ACE2 normalized expression. Right: comparison of ROC curves of predictive models by univariate (IFNB1) or multivariate (IFNB1/age/sex and age/ORF7a/ACE2) logistic regression. ROC curves showing significant prediction of fatal versus non-fatal COVID-19 according to IFNB1 transcript levels (right), with and without age and sex as additional factors (detailed in the Results section). For a–c, statistical results are from Kruskal–Wallis test with FDR correction for multiple testing (PCRneg n = 10, PCRpos n = 30, fatal n = 20), ****P < 0.0001, ***P < 0.001, **P < 0.01, *P < 0.05, NS, not significant. PCRpos, PCR positive; PCRneg, PCR negative.

