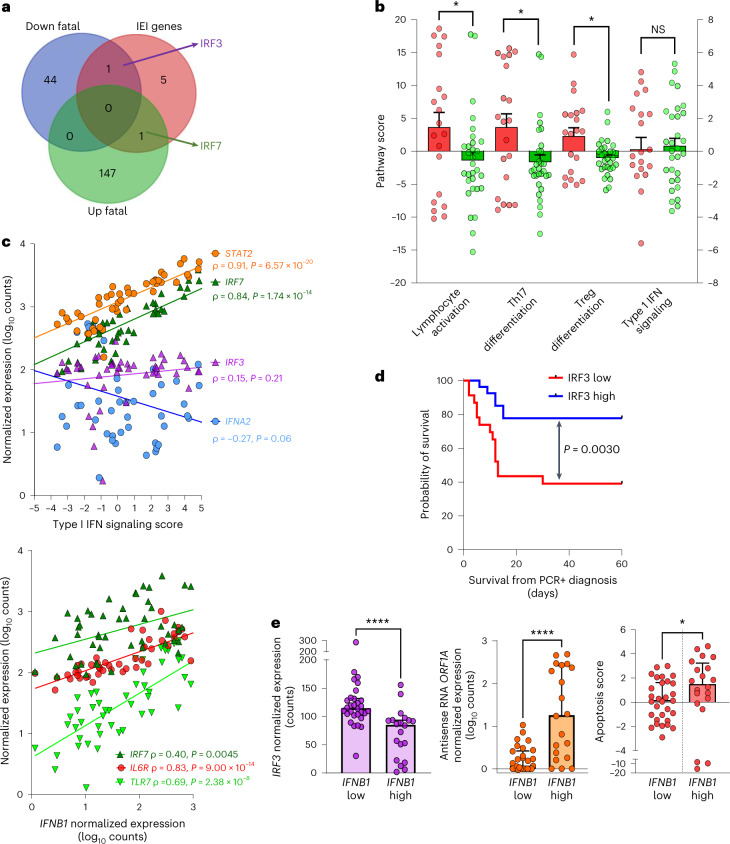
Fig. 4. IRF3/IRF7 dichotomy in type I IFN signaling underlies IFN-β link to inflammation, apoptosis and mortality in nursing home residents during post-vaccine COVID-19 outbreaks.
a, Venn diagram shows overlap between gene transcripts upregulated (‘up Fatal’) or downregulated (‘down Fatal) in fatal cases versus PCR-positive controls (quantified by nCounter digital transcriptomics) and the gene mutations (IEI) identified in life-threatening COVID-19 (ref. 28) (pre-vaccine era). The five IEI genes not differentially expressed between cases and controls are TICAM1, TBK1, UNC93B1, IFNAR1 and TLR3. b, Pathway scores (calculated by nSolver from gene expression profiling by nCounter) for lymphocyte activation (P = 0.043), Th17 (P = 0.028) and Treg differentiation (P = 0.022) were increased in fatal cases versus PCR-positive controls, whereas type I IFN signaling was not (t-test with Welch’s correction). No pathways were significant after stringent Bonferroni correction for multiple testing. Data are presented as median values ± s.d. Red circles: fatal cases; green circles: PCR-positive controls. c, Spearmanʼs correlation of type I signaling score (upper panel) and IFNB1 expression (lower panel) with drivers of IFN signaling (STAT2, IRF7, IRF3, IFNA2 and TLR7) and inflammation (IL6R), across all 50 residents (20 fatal cases and 30 PCR-positive controls). d, Kaplan–Meier curve demonstrating significantly lower (log-rank test) survival in nursing home residents with ‘IRF3 low’ status (nCounter normalized expression below the median). e, Classification of nursing home residents into ‘IFNB1 high’ versus ‘IFNB1 low’ (below or above 100 normalized counts) reveals a significant link with IRF3 expression (Mann–Whitney test P = 0.000011), intracellular viral replication (measured as SARS-CoV-2 antisense RNA, Mann–Whitney test P = 0.000072) and apoptosis score (calculated by nSolver, Mann–Whitney test P = 0.044) in upper airway mucosa. Data are presented as median values ± s.d. ****P < 0.0001, **P < 0.01, *P < 0.05, NS, not significant. PCR+, PCR positive.

