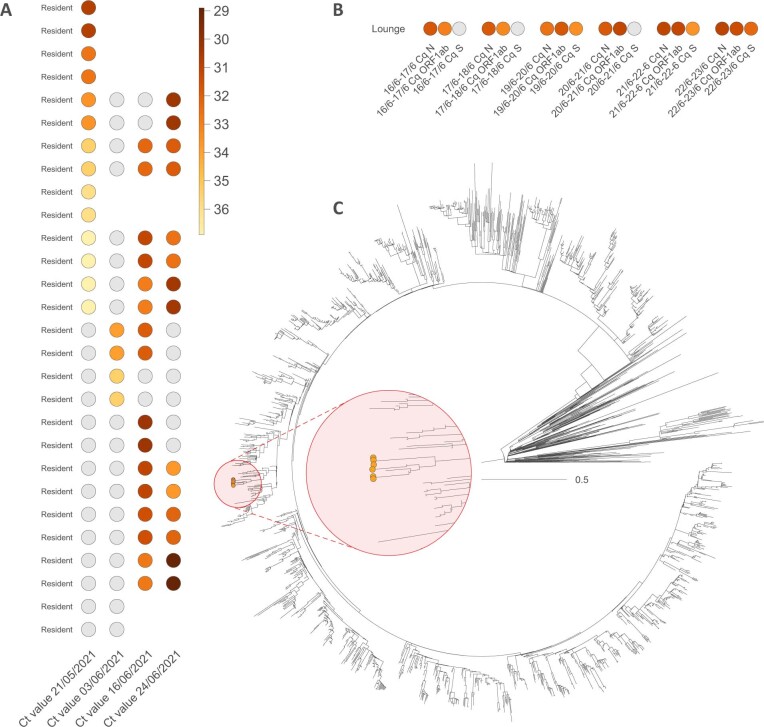
Extended Data Fig. 1. Overview of the outbreak in nursing home B (Gamma/P.1).
We report the evolution through time of Ct values measured in both infected residents (a) and aerosols analyzed in the lounge of the nursing home (b). Grey dots refer to negative PCR results. In addition, we also report the time-scaled phylogenetic analysis involving Gamma (P.1) genomes sampled and sequenced from this outbreak (c), showing one phylogenetic cluster (zoomed in the red circle, scale bar corresponds to the full tree) among 6 full genomes (orange dots), likely corresponding to a single introduction event into nursing home B. The phylogenetic tree is time-calibrated, meaning that branch lengths are in units of time (year).

