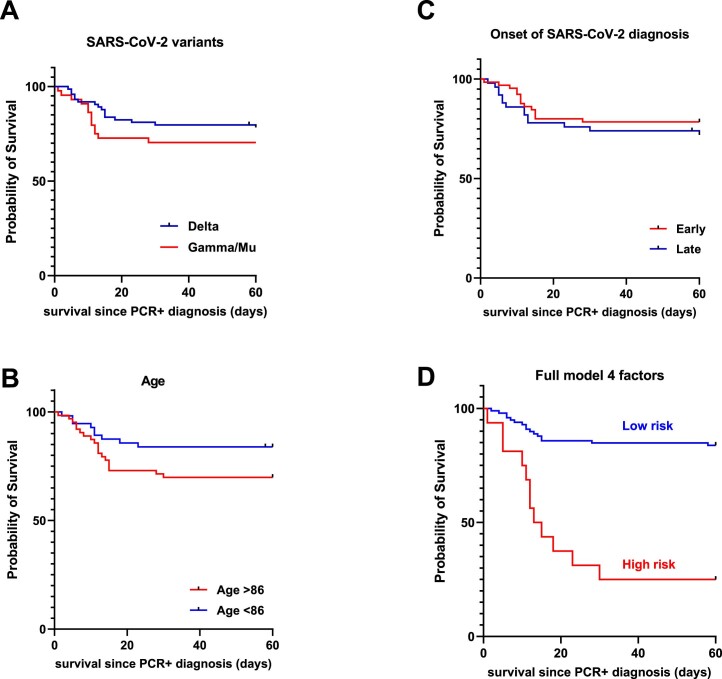
Extended Data Fig. 3. Univariate and multivariate Kaplan-Meier survival curves.
Kaplan-Meier survival curves comparing (a) SARS-CoV-2 variants Delta vs. non-Delta (Gamma/Mu, Log-rank test, p = 0.28), (b) Age above or below the median (86 years, Log-rank test, p = 0.078); (c) Onset of SARS-CoV-2 diagnosis (PCR+): early (0–7 days) vs. late (>7 days), with regard to the start of the respective outbreaks, Log-rank test, p = 0.40; (d) Combined probability of age, sex, variant, and late onset of diagnosis (Log-rank test, p = 1.1 × 10⁻⁷).

