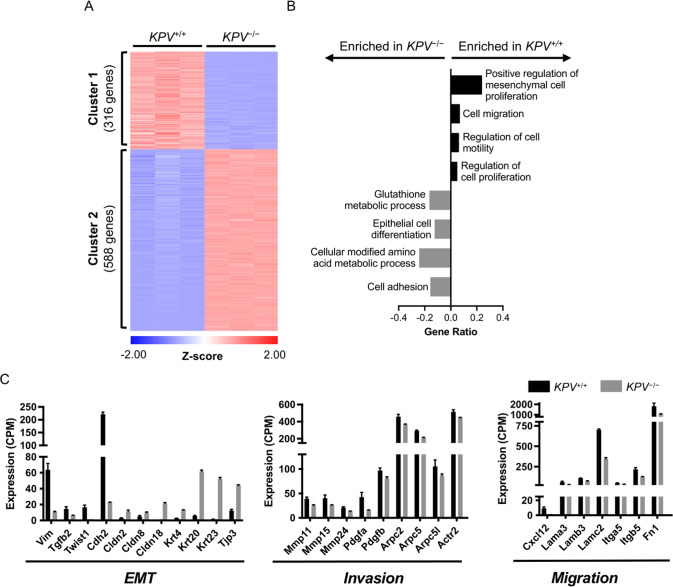
Fig. 2. KPV−/− cells have decreased expression of genes involved in EMT.
Messenger RNA collected from KPV+/+ and KPV−/− cells was subjected to RNA sequencing. A Differentially expressed genes (DEGs) between KPV+/+ and KPV−/− cells were clustered using K-means clustering. B Genes enriched in Cluster 1 (316 genes) and Cluster 2 (588 genes) were subjected to GO enrichment analysis. GO Processes with FDR < 0.05 are shown. GeneRatio is the number of genes in the cluster associated with the GO process divided by the total number of genes in that GO process. C Expression values (counts per million; CPM) of select genes are shown. N = 3 for each group. Data in panel C are presented as the mean ± standard deviation. All gene comparisons (KPV+/+ vs. KPV−/−) have FDR < 0.05 after adjusting for multiple comparisons; therefore, all gene differences shown between KPV+/+ vs. KPV−/− cells are statistically significant.

