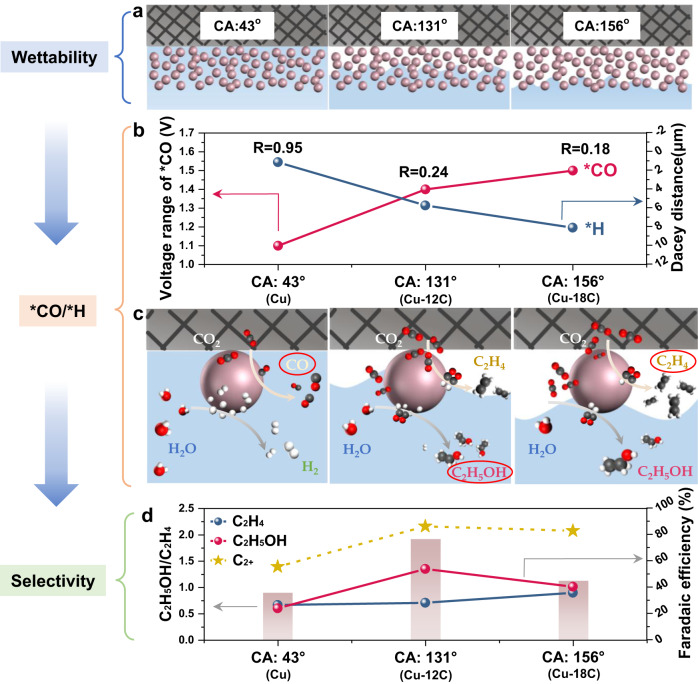
Fig. 5. Illustration of the role of controllable wettability on the reaction pathways of ethylene and ethanol.
a Schematics of interfacial contact states of Cu (CA: 43°, liquid-gas contact), Cu-12C (CA: 131°, gas–liquid–solid contact), and Cu-18C (CA: 156°, gas-solid contact). The white and blue parts in the schematics represent gas and liquid, respectively. b Correlation between interfacial wettability and *CO and *H. Voltage ranges from in-situ ATR-SEIRAS spectra and decay distances from CLSM are used to compare *CO and *H coverage, respectively, at different interfacial wettability. With the increase of hydrophobicity, *CO coverage increases while *H coverage decreases. The ratio of voltage range (*CO) over decay distance (*H) (denoted as R, V/μm) is adopted to represent the *CO/*H ratio. c Schematics of the reaction pathways and product formation on Cu, Cu-12C, Cu-18C with different wettability (blue: liquid, white: gas). d The variety of product selectivity with different interfacial wettability. The reaction pathway of C2 product is jointly determined by *CO coverage and *H coverage. The Faradaic efficiencies toward ethanol and C2+ of up to 53.7% and 86.1%, respectively. The illustrations show that the kinetic-controlled *CO/*H ratio derived from the interfacial contact state affects the ethylene and ethanol pathways. CA: contact angle.

