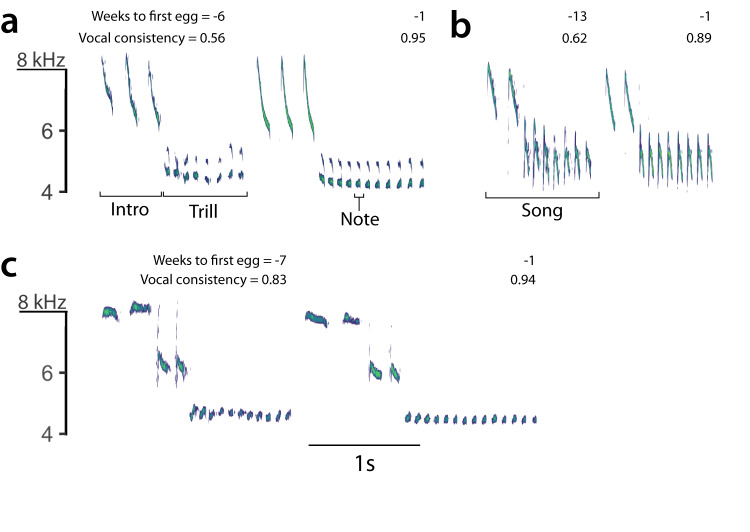
Fig. 1. Spectrograms of typical songs of blue tits.
Each of the three pairs of spectrograms (a–c) shows two songs recorded from the same individual male, one before the breeding period (left) and the second during the females’ fertile period (right), with the frequency (kHz) in the Y-axis and time in seconds in the X-axis. Spectrograms (a, b) show annotations describing the basic structure of song in this species. The vocal consistency measured for each song is shown in the upper right corner, with 1 as the maximum consistency possible. The time when it was recorded during the season is also indicated as weeks in relation to the first egg date.

