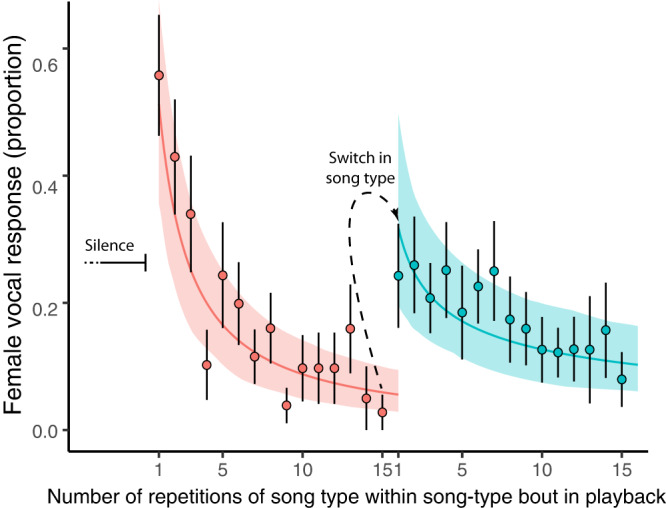
Fig. 5. Female vocal response per song position within playback song-type bouts.

The X-axis shows the sequential position of each song within a song-type bout. In this case, the first 15 repetitions are shown, matching the analysis of change in vocal consistency within song-type bout in male dawn song. The Y-axis shows the proportion of playback songs with at least one female vocalisation, out of all songs played per trial in that position. Each point represents the mean ± SE female vocal response per song position across all trials, summarizing the response of 13 females to 34 song-type bouts preceded by silence (in red) and 60 song-type bouts preceded by a song type switch (in blue). The lines show the predicted values for female vocal response derived from the model, with the associated 95% confidence intervals in shaded area. The decrease in response as the song is repeated indicates behavioural habituation of the females while the switch in song type elicited dishabituation. The data included song type switches between ten different song types across trials and in all possible directions, i.e., from song type A to song type B but also from song type B to song type A. Source data are provided in Supplementary Data 2.
