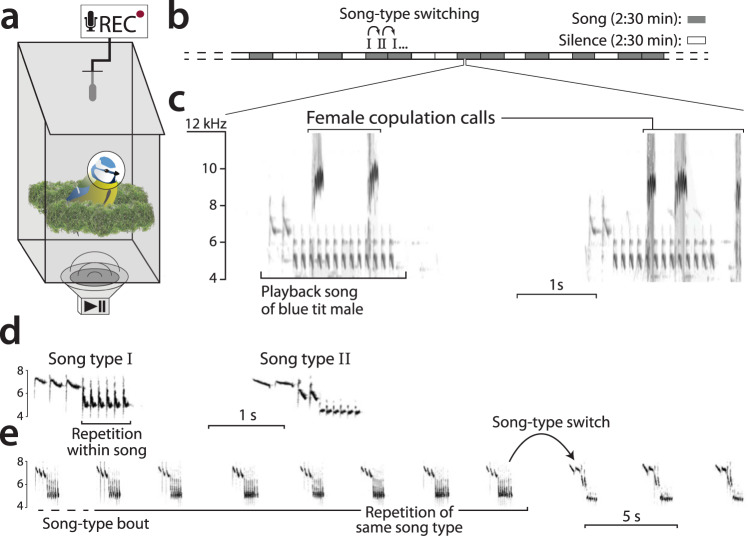
Fig. 6. Diagram of methods used in the female choice playback experiment.
In (a), a schematic overview of the equipment set up at the nest box, see also Fig. S5. In (b), a schematic timeline indicating the structure of a playback stimulus, alternating periods of song with silence. Spectrogram (c) shows an audio snapshot recorded inside the nest box during a playback trial, showing the vocal interaction of a subject female with the playback song, with frequency (kHz) in the Y-axis and time in seconds in the X-axis. Spectrograms (d) and (e) show the repetition at different time scales in a natural recording of a male singing. In (d) one note is repeated within song (this is where we measure vocal consistency), and in (e) the entire song is repeated within a song-type bout.

