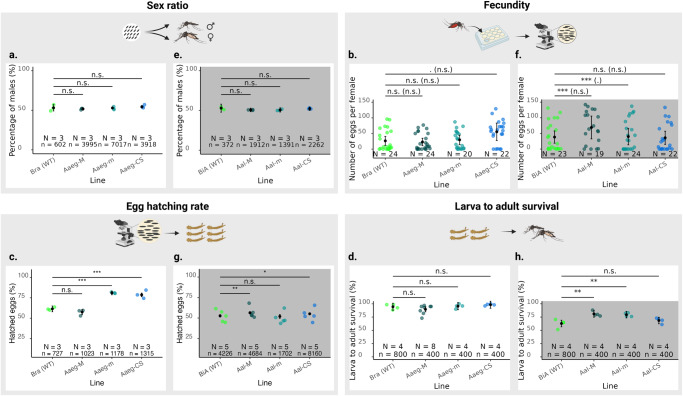
Fig. 3. Fitness of the genetic sexing strains and of the intermediary colony yielding non-transgenic males.
In all panels, the black dots with vertical bars represent the mean value and the 95% CI in the Ae. aegypti and Ae. albopictus assays, respectively. The large coloured dots around estimates represent the mean values of each replicate (N). Significant differences between the lines are specified in the figure (n.s.: no significant difference. *p-value < 0.1, **p-value < 0.01, ***p-value < 0.001). The percentages of males were compared using a generalised linear model with a binomial distribution in the Ae. aegypti (a) and Ae. albopictus (e) lines. Comparisons of the mean number of eggs laid by an individual female were analysed using a hurdle model with a negative binomial distribution in the Ae. aegypti (b) and Ae. albopictus (f) lines. Significance of the hurdle model is displayed in two parts: probability of the non-zero values and probability of attaining value 0 (between parentheses). Comparisons of the percentage of egg hatch were analysed using a generalised linear model with a binomial distribution in the Ae. aegypti (c) and Ae. albopictus (g) lines. Comparison of survival from first instar larvae to adult stages were analysed using a linear model with the assumption of residual normality in the Ae. aegypti (d) and Ae. albopictus (h) lines. Figure designed on BioRender.com.

