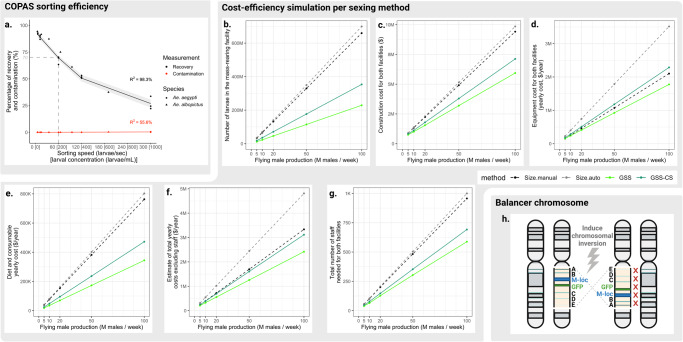
Fig. 5. Evaluation of the feasibility of using GSS in Aedes SIT, and suggested improvement.
a Evolution of male recovery and female contamination rates as a function of COPAS sorting speed. 10,000 Ae. aegypti L1 larvae from the crossing scheme were COPAS-sorted at different concentrations, resulting in different sorting speeds. Percentage of recovery (black dots) and percentage of contamination (red dots) were measured on three replicates for each sorting speed. Recovery values were fitted using a degree-two polynomial regression (R2 = 0.983) and contamination values were fitted using a linear regression (R2 = 0.556). The model predictions were plotted by black and red lines, respectively, with 95% confidence intervals ribbons. The same experiment was repeated with 4000 Ae. albopictus L1 larvae from the crossing scheme and is shown on the same graph. In this species, percentage of recovery (black triangles) and percentage of contamination (red triangles) were measured on a single replicate for each sorting speed. b–g Estimate of the cost-efficiency of Genetic Sexing Strains for Aedes SIT by simulating the construction of a mass rearing and a release facility with different sexing systems. Included sexing systems were the manual sorting of pupae using glass plates, “Size manual” (dashed black lines), the automated sorting of pupae with robotic glass plates, “Size auto” (dashed grey lines), the automated sorting of L1 larvae from a GSS using COPAS, “GSS” (light green lines), and the combination of two GSS for automated sorting of non-transgenic L1 larvae, “GSS-CS” (dark green lines). Different production objectives were considered: release of 5, 10, 20, 50 and 100 million males per week for 52 weeks per year. b Comparison of the number of larvae present at any time in the rearing facility. c Comparison of the construction cost in US dollars for both the mass rearing and the release facilities. d Comparison of the equipment cost in US dollars for both the mass rearing and the release facilities (yearly cost estimated by dividing the cost of each equipment by its lifespan). e Comparison of the diet and consumable cost per year in US dollars for both the mass rearing and the release facilities. f Sum of the yearly costs for construction (estimated lifespan = 20 years), equipment, diet and consumables in US dollar. g Comparison of the number of staff (labourers, managers etc.) needed for both the mass rearing and the release facilities. h Proposed chromosomal inversion that could prevent recombination between the fluorescence marker and the sex-locus. Figure designed on BioRender.com.

