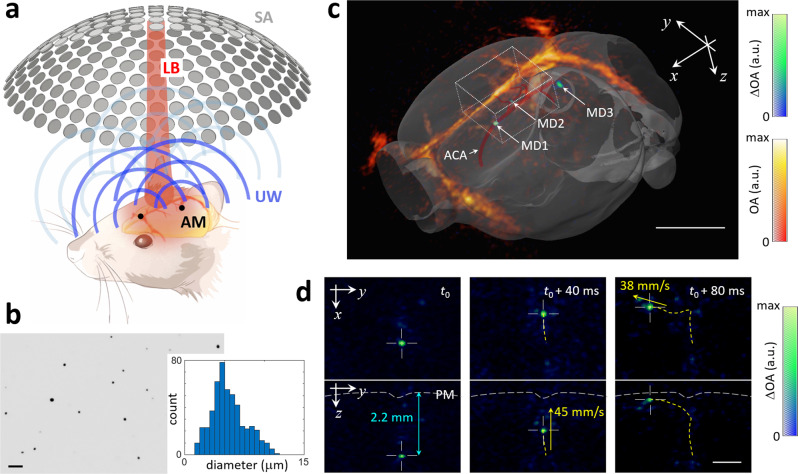
Fig. 1. Detection and tracking of individual microdroplets with localization optoacoustic tomography (LOT).
a Lay-out of the experimental setup. AM absorbing microdroplets, LB laser beam, UW ultrasound waves, SA spherical array. b Bright field (5×) optical microscopy image of the dichloromethane (DCM) microdroplets along with a histogram of the measured diameters from 500 microdroplets. Scalebar—50 μm. The measurements were repeated 3 times to ensure reproducibility. c OA images of the mouse brain superimposed to the differential (background subtracted) OA (ΔOA) images. Three microdroplets in the azygos pericallosal artery (MD1), middle internal frontal artery penetrating branches (MD2) and pial surface (MD3) are labeled in the differential image. The co-registered Allen mouse brain atlas is also shown. ACA anterior cerebral artery. Scalebar—3 mm, a.u. arbitrary units. Cartesian axes are indicated with arrows. d Maximum intensity projections (MIPs) of the differential OA image along the z and x directions for the rectangular box indicated in c. Three representative time points are shown. The depth from the pia matter (PM) and the calculated velocities are indicated in blue and yellow, respectively. Scalebar—1 mm, a.u. arbitrary units.

