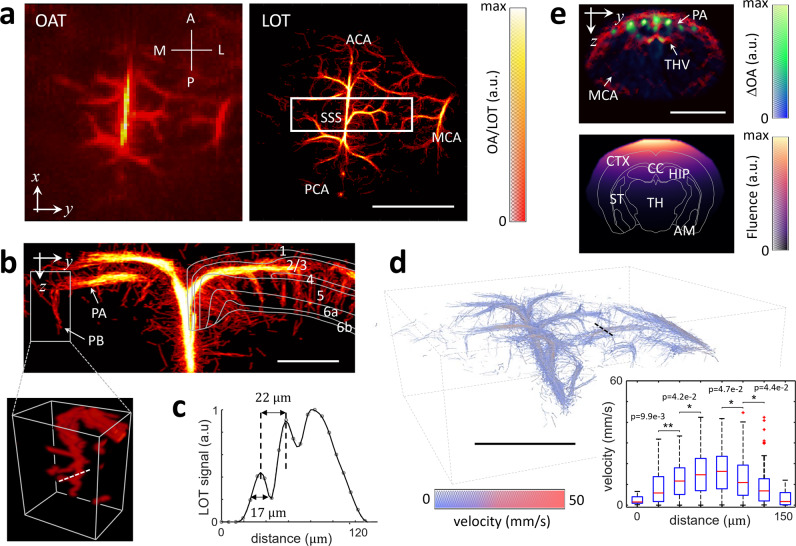
Fig. 2. Structural and functional imaging with LOT.
a Maximum intensity projections (MIPs) along the z direction (dorsal view) of the 3D images rendered with conventional OA tomography (OA, left) versus localization optoacoustic tomography (LOT, right). A anterior, P posterior, M medial, L lateral, ACA anterior cerebral artery, MCA middle cerebral artery, PCA posterior cerebral artery, SSS superior sagittal sinus. Scalebar—3 mm, a.u. arbitrary units. b MIP images along the x direction (coronal view, Bregma −0.22 mm to −1.22 mm) of the rectangular box of the LOT image indicated in (a). Cortical layers are indicated. The inset displays a 3D view of the indicated region. PA pial arteriole, PB penetrating branches. Scalebar—1 mm. c Profile of the LOT image for the dashed white line in b, a.u. arbitrary units. d 3D view of the blood flow image. Inset shows boxplots of the measured velocities (40 values per boxplot) along the dashed black line. Outliers are plotted as red squares. Mean+1.26σ, upper quartile, median, lower quartile, and mean-1.26σ are shown. Values for individual droplets are provided in a supplementary file. Statistical significance is shown (*p < 0.05, **p < 0.01 for one-tailed unpaired t test). Scalebar—3 mm. e Cross-sectional coronal view (top, approx. Bregma −1.46 mm) of the OA image along with the superposition of 8 differential OA images (ΔOA). The light fluence distribution image (bottom) is derived by fitting the signals of 50 microdroplets in the differential OA images to an exponentially decaying function. MCA middle cerebral artery, PA pial artery, THV transverse hippocampal vein, CTX cortex, CC corpus callosum, HIP hippocampus, TH thalamus, ST striatum, AM amygdala. Scalebar—5 mm, a.u. arbitrary units.

