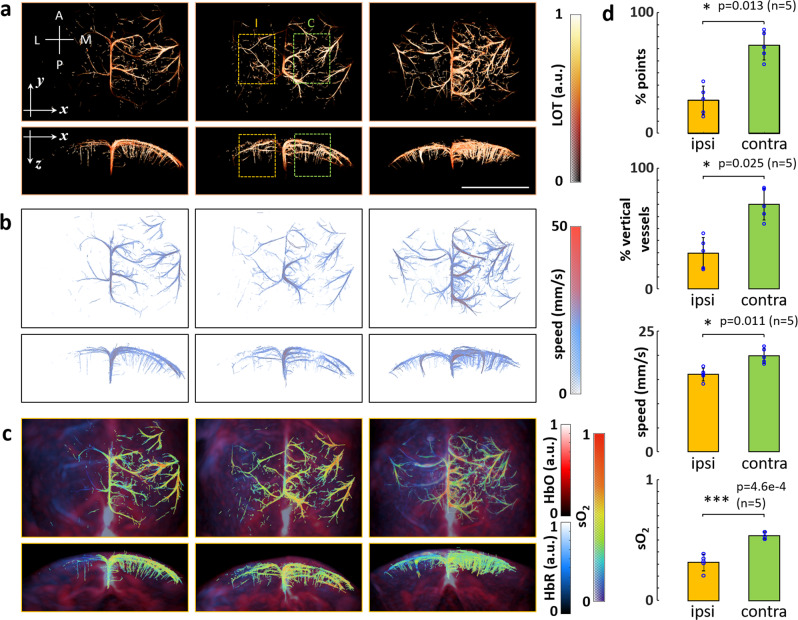
Fig. 3. Multi-parametric characterization of ischemic stroke in mice with LOT.
a Maximum intensity projections (MIPs) along the z (dorsal view) and y (coronal view) directions of the LOT images acquired in vivo from three mice affected by ischemic stroke. A anterior, P posterior, M medial, L lateral, I ipsi-lateral, C contra-lateral. Scalebar—4 mm, a.u. arbitrary units. b Dorsal and coronal MIPs of the corresponding velocity maps. c Dorsal and coronal MIPs of the corresponding bio-distributions of oxygenated (red) and deoxygenated (blue) hemoglobin, a.u. arbitrary units. Oxygen saturation (sO2) values in the microvascular structures resolved with LOT are superimposed. d Statistical analysis of the measured parameters in selected volumes of interest (VOIs, orange and green regions indicated in a) in ipsi-lateral and contra-lateral sides of the brain. The number of mice (n) considered are indicated. Individual measurements are plotted as blue circles. First row—Relative number of localized points in ipsi- (27.27% +/− 11.90%) and contra-lateral (72.73% +/− 11.90%) sides. Second row—Relative number of vertical vessels in ipsi- (29.72% +/− 12.99%) and contra-lateral (70.28% +/− 12.99%) sides estimated as the relative L1-norm of the Sobel-filtered LOT image for the selected VOIs. Third row—Blood flow velocities in the visible vessels in the ipsi- (16.05 mm/s +/− 1.31 mm/s) and contra-lateral sides (19.97 mm/s +/− 1.58 mm/s). Fourth row—Oxygen saturation in the visible vessels in the ipsi- (0.3087 + /− 0.0594) and contra-lateral (0.5453 + /− 0.0293) sides. Data are presented as mean values +/− standard deviation. Statistical significance is shown (*0.01 < p < 0.05, ***p < 0.001 for a two-tailed paired-sample t test).

