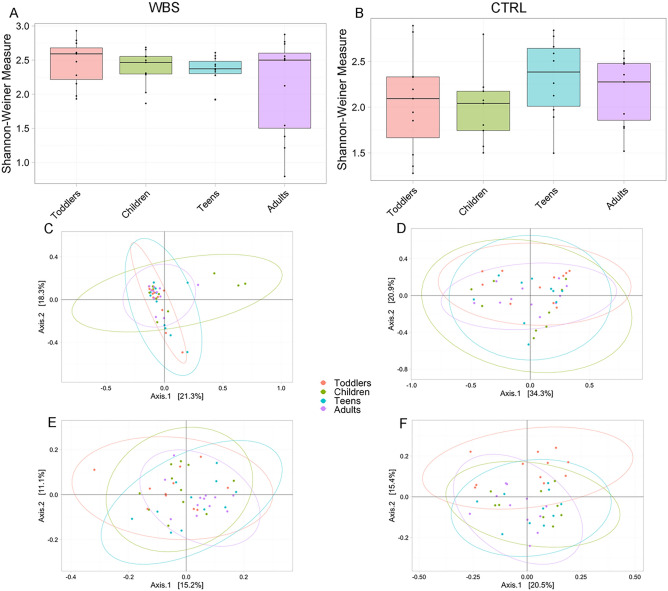
Figure 1.
Ecological analyses of WBS and CTRL stratified by age groups. Alpha diversity analysis (A and B). Box plots show the Shannon-Weiner index of WBS and CTRL groups based on their age’s classes. In box plot the values of median, first and third quartiles, minimum and maximum values of Shannon index for each group are reported. Statistical test is performed by Kruskal–Wallis test (p-adj values > 0.05). Beta-diversity analyses. Principal Coordinates Analysis (PCA) plots of Bray Curtis dissimilarity (C and D) and Unweighted UniFrac phylogenetic distance matrices (E and F). Each ellipse represents the 95% confidence interval of standard error. The PERMANOVA test applied on Bray–Curtis dissimilarity reveals the absence of a statistically significant dissimilarity amongst age groups (WBS p value = 0.11, CTRL p value = 0.11). The PERMANOVA test applied on Unweighted UniFrac reveals a statistically significance (WBS p value = 0.02, CTRL p value = 0.04). The ANOSIM test on Bray–Curtis confirms the similarity amongst the age groups (WBS: R-value = 0.02, p value = 0.21; CTRL: R value = 0.06, p value = 0.08). The same analysis performed on Unweighted UniFrac matrices results not statistically significant for WBS (R = 0.03; p value = 0.09) while statistically significant for CTRLs (R-value = 0.09; p value = 0.01).

