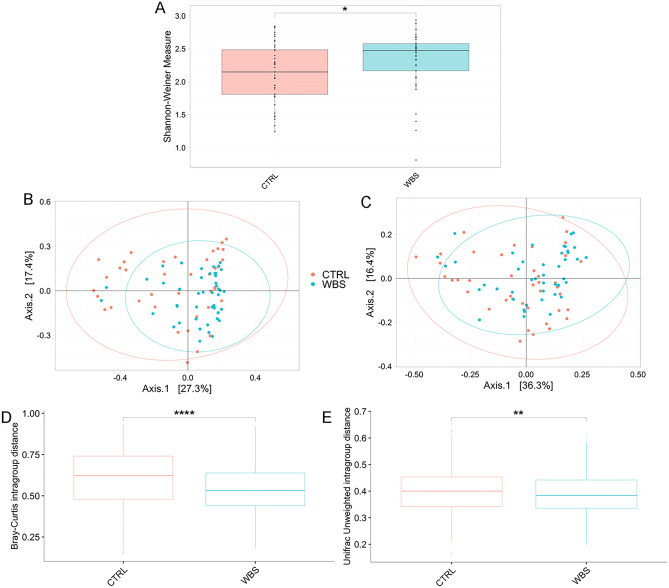
Figure 2.
Ecological analyses of WBS and CTRL. Alpha diversity analysis (A). Box plots show the Shannon-Weiner index of WBS and CTRL. In box plot the values of median, first and third quartiles, minimum and maximum values of Shannon index for both groups are reported. Beta-diversity analyses. Principal Coordinates Analysis (PCA) plots of Bray Curtis dissimilarity (B) and Unweighted UniFrac phylogenetic distance matrices (C). Each ellipse represents the 95% confidence interval of standard error. The PERMANOVA and ANOSIM tests applied on β-diversity matrices reveal the statistically significant dissimilarity between WBS and CTRLs (Bray–Curtis matrix: PERMANOVA p value = 0.002; ANOSIM: R value = 0.10, p value = 0.001; unweighted UniFrac matrix: PERMANOVA p value = 0.001; ANOSIM R value = 0.14; p value = 0.001). Intragroup distances calculation. Box plots of intragroup distances calculated on (D) Bray–Curtis and (E) Unweighted UniFrac distances. Statistically significant comparisons by Wilcoxson test are indicated by asterisk (*p-adj ≤ 0.05; **p-adj ≤ 0.01; ****p-adj ≤ 0.0001).

