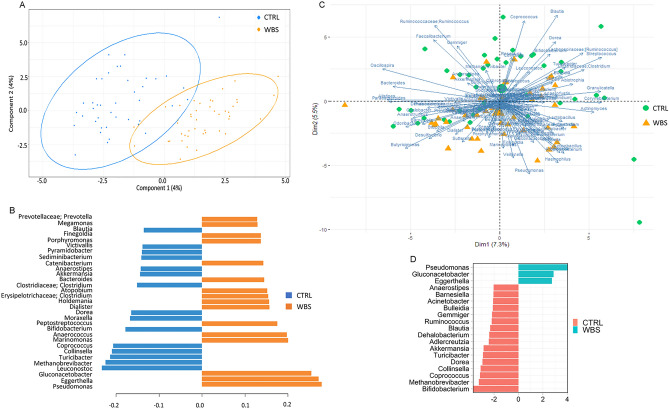
Figure 3.
Compositional analyses at the genus level of WBS and CTRL. (A) Partial least squares discriminant analysis (PLS-DA) plot; (B), plot of loading variables, filtered for loading coefficient > 0.1. The Root Mean Square Error (RMSE) = 0.24 indicates a good accuracy in classification’s prediction; (C), Principal component analysis (PCA) plot. More the loadings are distant from the origin, more they influence the model. The loadings separated by a small angle show a positive correlation; the loadings separated by a large angle have a negative correlation, and those with a right angle indicate no correlation. (D), Univariate ANCOM-BC plot.

