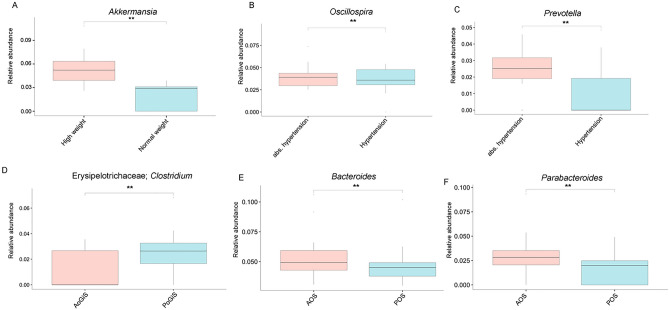
Figure 5.
Compositional analyses at genus level of patients stratified for weight‐related and clinical features. Box plots indicate the median abundances and interquartile ranges of the taxa resulted statistically significant by ANCOM-BC test (*p-adj ≤ 0.05; **p-adj ≤ 0.01;). (A) comparisons between WBS normal weight and high weight; (B and C) comparisons between patients stratified for the presence of hypertension or not (abs. hypertension); (D) for absence (AoGiS) or presence of gastrointestinal symptoms (PoGiS) (constipation or diarrhoea); (E and F) for absence (AOS) or presence of at least 1 gastrointestinal symptom (POS) (gastroesophageal reflux disease, diarrhoea, constipation, abdominal pain).

