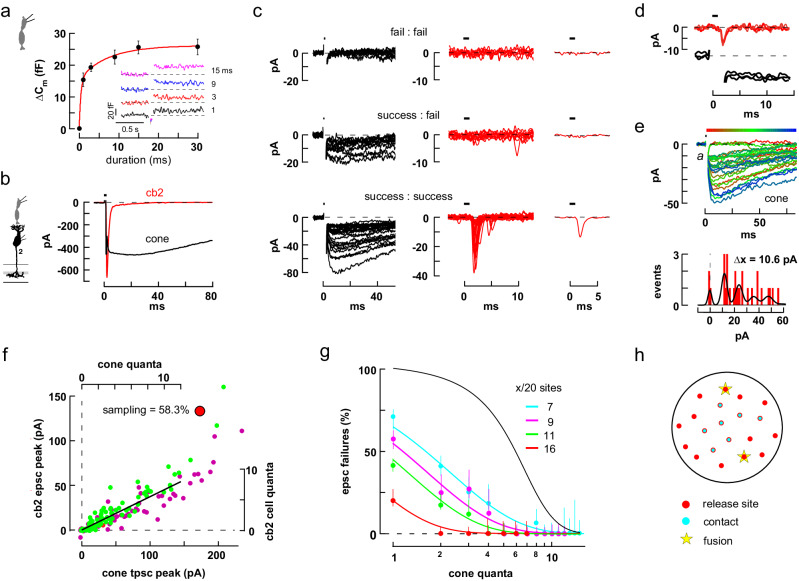
Fig. 2. Cone to cb2 cell synapses are linear.
a Plot of ΔCm versus step (–70 to –10 mV) duration fitted with a bi-exponential curve (n = 7 independent cones; mean ± S.E.). Inset. Individual responses. b Maximal pre- and postsynaptic currents elicited by a brief cone depolarization (horizontal bar). c Grouped traces selected from a train of 98 consecutive cone depolarizations to either -35 or -30 mV. Upper row. Left. Superimposed cone response failures. Middle. Corresponding BC traces. Right. Averaged BC response consistent with an absence of events. Middle row. Pairs selected for cone response accompanied by BC failure. Bottom row. Larger cone tpscs with corresponding BC epscs. Upper and middle rows show all responses that met the criteria. For clarity, the lower row shows one-quarter of the responses. d Three trace pairs showing small, near-identical responses in the cone and BC. e Consecutive tpsc responses following 1 ms steps from -70 to -30 mV color-coded according to temporal sequence (above). Amplitude histogram with sum-of-Gaussians fit (below). f Plot of BC peak epsc versus cone peak tpsc amplitude. Green (steps to –35) and purple (to –30 mV) circles encompass the traces in c; red circles plot responses during steps to –40 mV. Axes (top and right) were scaled by unitary event amplitudes in the cone and BC. A straight-line fit to the scaled data had a y-intercept of 0.039 quantal units. Large red circle denotes the corresponding data points in Fig. 2g. g Epsc response failures plotted against tpsc quantal content for 4 independent cone to cb2 cell pairs and fitted with theoretical curves (see “Methods”). The black curve shows the limiting case in which all release sites are sampled and a success requires ≥2 released vesicles at any site. Confidence intervals (50%) are related to trial number and failure probability (see “Methods”). h Cone terminal model for cb2 responses showing 20 release sites, x = 7 of which are contacted by dendrites. Vesicles randomly fusing at 2 sites (e.g., stars) produce response failures with a probability of 0.42. Source data for this and subsequent figures are provided as a Source Data file. Silhouettes republished from Neuron, Vol 91, Grabner, C. P. et al. Mechanism of High-Frequency Signaling at a Depressing Ribbon Synapse, 133–145, (2016), with permission from Elsevier.

