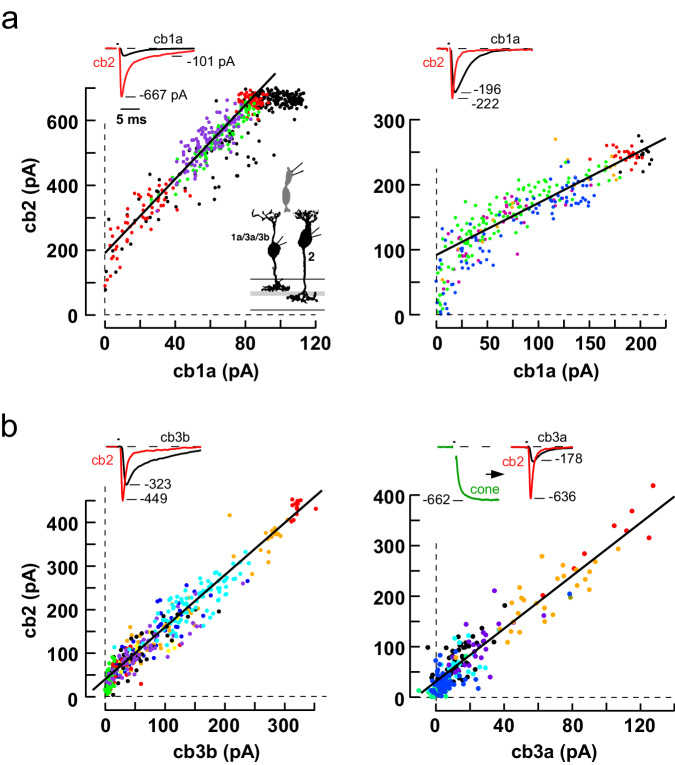
Fig. 4. Simultaneous epscs in two BCs postsynaptic to a single stimulated cone.
a Scatterplots of peak cb2 versus peak cb1a epsc response during several stimulus epochs (different colored points; left, linear fit slope = 5.7 and y-intercept = 190 pA; right, 0.8 and 90 pA). b Scatterplot of simultaneous responses in cb2 cells paired with either a cb3b or a cb3a cell (left, slope = 1.2 and y-intercept = 40 pA; right, 2.6 and 31 pA). Insets. Simultaneous peak BC responses (first three plots) evoked by stimulating a cone (1 ms pulse) in the loose seal mode. In the plot on the lower right, cone voltage was maintained in voltage clamp. BC silhouettes republished from Light, A. C. et al. Organizational motifs for ground squirrel cone bipolar cells. J Comp Neurol 520, 2864-2887 (2012). Cone silhouette republished from Neuron, Vol 91, Grabner, C. P. et al. Mechanism of High-Frequency Signaling at a Depressing Ribbon Synapse, 133-145, (2016), with permission from Elsevier.

