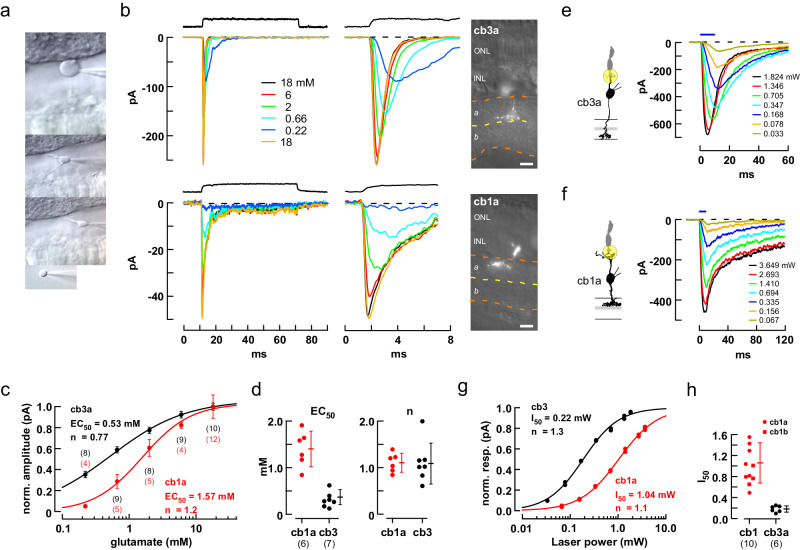
Fig. 5. Responses of isolated cb3 and cb1 cell KARs to different concentrations of glutamate.
a Sequence illustrates the procedure for withdrawing a BC soma while leaving an intact axon and dendrite in the slice. b Responses of representative somas to rapid applications of glutamate (0.22–18 mM). Solution exchange temporal profiles (black traces, above). The entire step response is shown on a slow time base (left) and the peak response on a faster time base (middle). Fluorescence images of the remaining axon/dendrite allow identification of the cell type (right; scale bar = 10 µm). c Plot of normalized peak response versus concentration for the cells in (b). Individual points are averages at a concentration (number of trials shown above and below; mean±S.D.). d Categorical scatterplots of EC50 and ‘n’ obtained from the Hill fits for cb1a and cb3 cells showing mean±S.D. and number of independent cells in parentheses. Hill coefficients were not statistically different (cb3: 1.09 ± 0.17; cb1: 1.11 ± 0.08; p = 0.922; two-tailed unpaired t test). e, f Responses of a cb3a and cb1a cell to glutamate uncaging. A 3 µm diameter uncaging spot, illustrated by the yellow circle, was focused on the dendrites of the recorded BC at a cone terminal. The amount of released glutamate was controlled by adjusting flash intensity (mW; flash duration shown above). 20-80% rise times were 1.23 and 2.17 ms for the maximal cb3a and cb1a responses, respectively. g Plots of normalized peak response versus spot intensity for the cells in e and f. Responses were fitted with a Hill Equation to obtain the laser intensity half-maximum, I50. h Plots of I50 for individual cb1 and cb3 cells. AMPA receptors were blocked with 35 µM GYKI 53655 in all experiments. Cb3a cell I50 = 0.18 ± 0.02 mW (mean ± S.E.; n = 6 independently recorded bipolar cells); cb1a cell I50 = 1.06 ± 0.17 mW; (n = 7 independent recordings; significantly different, p = 0.0002; two-tailed unpaired t test). Cb1a (n = 7) and cb1b (I50 = 0.98 ± 0.11 mW; n = 3) cell I50 values were not significantly different (p = 0.5082, two-tailed unpaired t test). BC silhouettes republished from Light, A. C. et al. Organizational motifs for ground squirrel cone bipolar cells. J Comp Neurol 520, 2864-2887 (2012). Cone silhouette republished from Neuron, Vol 91, Grabner, C. P. et al. Mechanism of High-Frequency Signaling at a Depressing Ribbon Synapse, 133-145, (2016), with permission from Elsevier.

