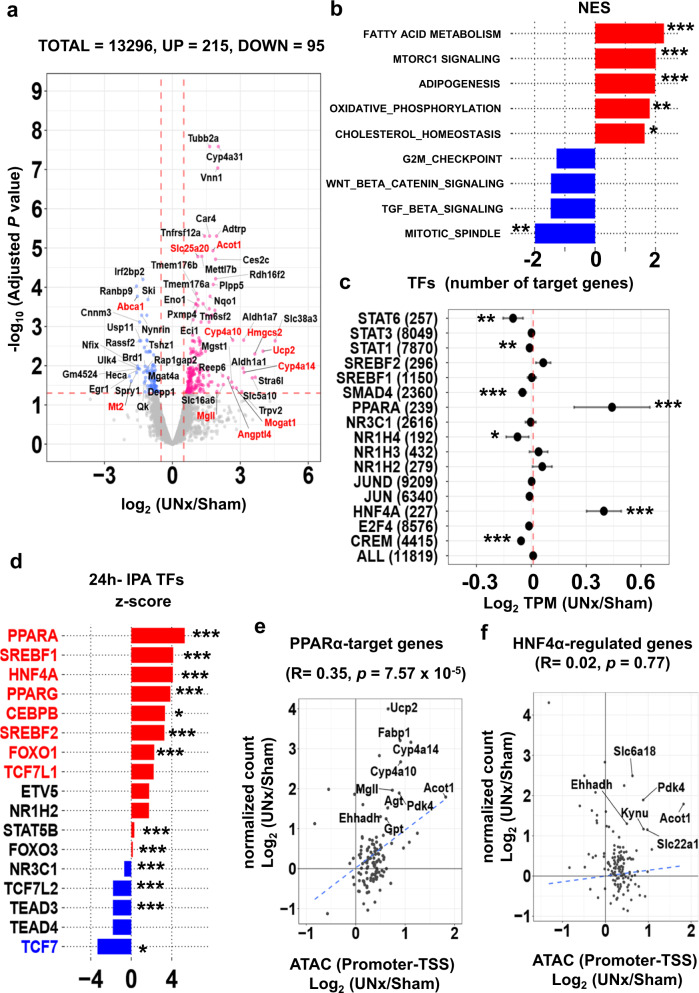
Fig. 4. Single-tubule RNA-seq for microdissected S1 proximal tubules (PT-S1) from Sham and UNx mice transcripts at 24 h.
a Volcano plot. Magenta points, significantly increased expression. Blue points, significantly decreased expression. Significant differential expression was determined using thresholds of padj < 0.05 and |log2(UNx/Sham)| > 0.5. Red font, genes known to be regulated by PPARα. (n = 3 for Sham, n = 4 for UNx). b Top-ranked Hallmark Pathway gene sets determined using Gene Set Enrichment Analysis (GSEA). Normalized enrichment score (NES) was calculated using PT-S1 differentially expressed genes for UNx vs. Sham treatments at 24 h post-surgery. *p < 0.05, **p < 0.01, ***p < 0.001 (weighted Kolmogorov–Smirnov test, p values are provided in Supplementary Table 2). c Target gene set analysis for TFs listed in Supplementary Table 1 at 24 h after UNx. Log2(UNx/Sham) values were plotted for members of curated target gene sets. Error bars indicate 95% confidence interval. The measure of center for the error bars is the averages of log2 ratios (UNx/Sham) of TPM values (in RNA-seq) for TF-target gene sets. The gene sets were listed in Supplementary Data 6. *p < 0.05, **p < 0.01, ***p < 0.001 (un-paired, two-tailed Student’s t-test, specific p values provided in Supplementary Data 8.) (n = 3 for Sham, n = 4 for UNx). d Prediction of upstream regulatory transcription factors using Ingenuity Pathway Analysis (IPA). Predictions performed using differentially expressed genes in UNx vs. Sham treatments at 24 h. Genes with normalized z-scores larger than 2, red; those with normalized z-scores less than −2, blue. *p < 0.05, **p < 0.01, ***p < 0.001. Fisher’s exact test (specific p values provided in Supplementary Data 10). e, f Correlation between gene expression and chromatin accessibility (UNx vs. sham treatments) for PPARα target genes (e) and for HNF4α target genes (f) at 24 h timepoint. *p < 0.05, **p < 0.01, ***p < 0.001 (Pearson’s correlation). TSS, transcription start site. Significant correlation was assessed with Pearson’s product moment correlation coefficient using the stat_cor function (method = Pearson, two-sided) in R.

