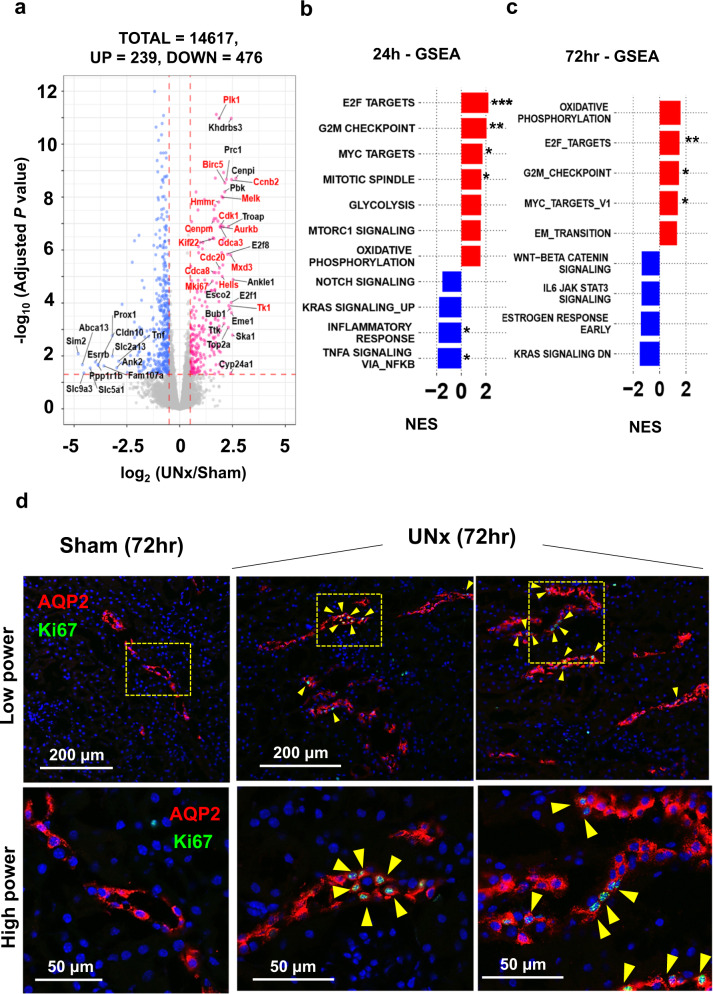
Fig. 5. Single-tubule RNA-seq for microdissected cortical collecting duct (CCD) from Sham and UNx at the 24 h and 72 h timepoint.
a Volcano plot for UNx vs. Sham. Magenta points, significantly increased expression. Blue points, significantly decreased expression. Significant differential expression was determined using thresholds of padj < 0.05 and |log2(UNx/Sham)| > 0.5. Known E2F targets highlighted in red font. (n = 4 for Sham, n = 3 for UNx). b, c Top-ranked Hallmark Pathway gene sets determined using Gene Set Enrichment Analysis (GSEA). Normalized enrichment score (NES) calculated using CCD differentially expressed genes for UNx vs. Sham treatments at 24-h post-surgery (b) and at 72-h post-surgery (c). *p < 0.05, **p < 0.01, ***p < 0.001 (weighted Kolmogorov–Smirnov test, p values are provided in Supplementary Table 3). d Immunofluorescence labeling of mouse renal cortex 72 h after Sham or UNx. Labelling for aquaporin-2 (AQP2; red) identifies collecting ducts. Ki67 (green) identifies dividing cells (yellow arrows). Representative images were selected from Sham (n = 8) and from UNx (n = 7) biological replicates.

