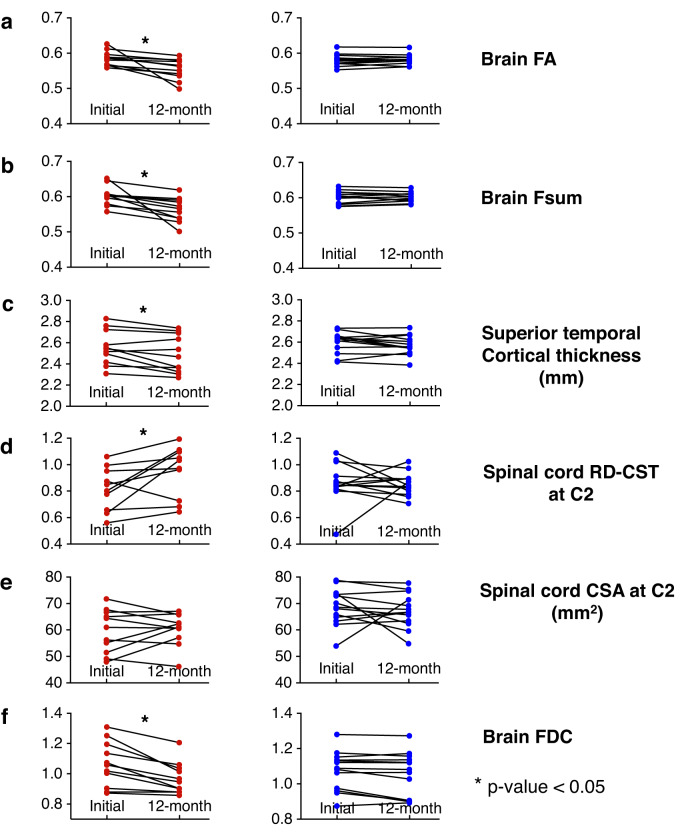
Fig. 6. Summary of longitudinal change in different brain and spinal cord measures.
Longitudinal changes in ALS participants (n = 11, panels in column 1) and controls (n = 13, panels in column 2) in (a) brain FA, (b) brain Fsum, (c) superior temporal cortical thickness, (d) spinal cord CST RD at C2, (e) spinal cord CSA at C2, and (f) brain FDC. The corresponding effect sizes and p-values of the longitudinal change in ALS participants are provided in Table 4 (ALS Amyotrophic lateral sclerosis, FA Fractional anisotropy, Fsum Sum of fiber volume fractions, RD Radial diffusivity, CST Corticospinal tract, C2 Spinal cord C2 level, CSA Cross-sectional area, FDC Fiber density and cross-section).

