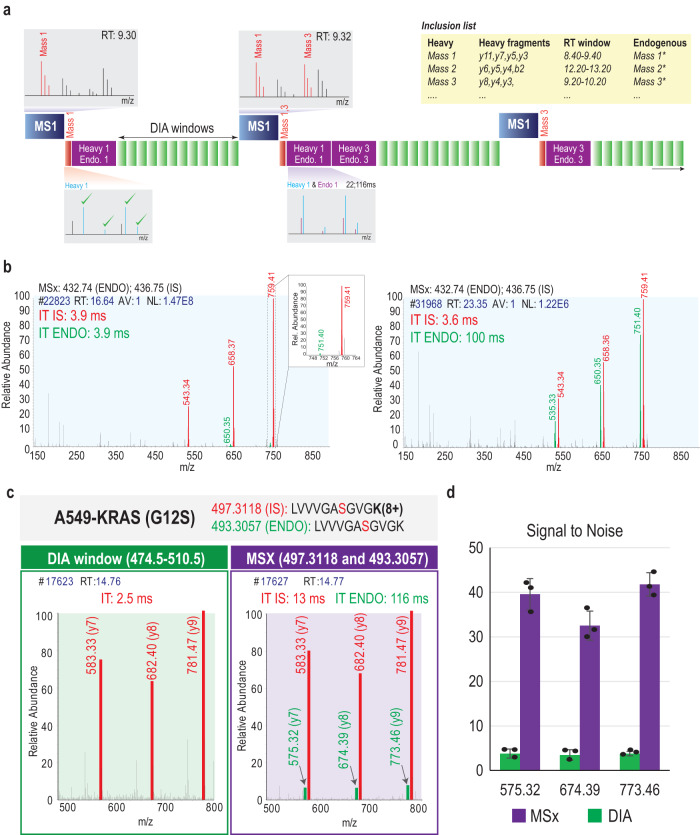
Fig. 1. Description of hybrid-DIA method.
a Description of the hybrid-DIA acquisition method. The figure represents a scheme of three acquisition cycles. A hybrid-DIA acquisition scan cycle starts with a full-scan or MS1 scan that it is acquired at high resolution. The hybrid-DIA API scans the MS1 for the precursor m/z values in the inclusion list that match the specific retention time window. If any is found (e.g., Mass 1) a targeted scan of this IS precursor m/z will be triggered as part of the subsequent MS/MS scan cycle (red box). The API will on-the-fly match the obtained fragments from that PRM scan (red box) to the IS peptide fragment values in the inclusion list. If the fragments match the expected values, then a targeted multiplexed scan (MSx) will be added to the cycle (purple box). This MSx scan (purple box) will simultaneously analyze the heavy (IS) and the endogenous (ENDO) peptide using non-synchronous injection times. Subsequently, the predefined DIA windows of the MS method will be acquired. Once the complete scan cycle is done, a new one will start and the process will be repeated in each cycle when heavy peptides are found in the MS1 scan. The box width reflects the injection times used for each scan, but it is not set to scale. b Example of the increase in sensitivity by using differential injection time in the multiplexed (MSx) scans. In red, spiked-in heavy stable isotopically labeled peptide standard (IS), and in green the triggered endogenous peptide (ENDO). c Example of a DIA scan and an IS/ENDO MSx scan from the same cycle where the heavy peptide carrying the G12S mutation, as well as its endogenous counterpart were isolated and fragmented. The top 3 y-fragments of each peptide are highlighted, in red the heavy fragments and in green the endogenous fragments. d Signal-to-noise (S/N) measured in the top 3 y-fragments in the endogenous G12S peptide in a DIA window (green) and in the MSx IS/ENDO scan (purple) in the same acquisition cycle. Height of the bars is the average S/N of three replicates, error bars are the standard deviation. RT: retention time; IT: injection time; m/z: mass to charge. Source data are provided as a Source Data file.

