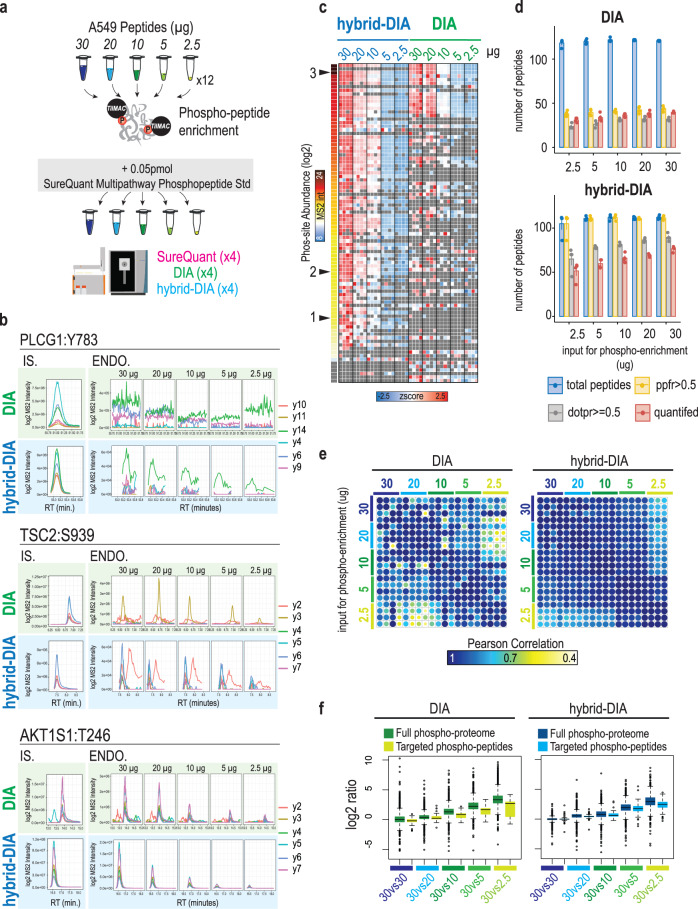
Fig. 3. Benchmark of hybrid-DIA versus standard DIA for sensitive phosphoproteomics analysis.
a Decreasing input material for phosphopeptides from A549 were used for phospho-enrichment (n = 4 replicates, 5 input amounts). Heavy-labeled peptide mixture was added, and samples were analyzed either by hybrid-DIA, DIA or SureQuant. b XIC for three phosphopeptides spanning the dynamic range of the phosphopeptide mixture. DIA runs in green, and data from MSx scans (corrected by injection time) in hybrid-DIA runs in blue. The three peptides represented in here correspond to peptides of different abundance in the sample as it is indicated as black arrows in c. RT: retention time, IS: heavy-labeled internal standard, ENDO: endogenous peptide. c Heatmap showing relative quantification (z-score intensities across samples) of targeted peptides in a dilution series experiment in hybrid-DIA (blue) and DIA (green). Sites are sorted by relative abundance. Black arrows indicate the position of the peptides used in b (3: AKT1S1-T246; 2: TSC2:S939; 1: PLGC1-Y783). d Barplots showing the number of targeted peptides detected and quantified in DIA (top) and hybrid-DIA (bottom) (n = 4 for each input amount, height of the bar indicates the mean of the four replicates, and the error bars the standard error). In blue, total number of heavy peptides detected when importing the data in Skyline. In yellow, number of heavy-endogenous pairs detected with a peptide-peak-found ratio or PPFR higher than 0.5. In gray, number of heavy-endogenous pairs with dot-product-ratio or DOTPR bigger or equal to 0.5. In red, number of heavy-endogenous pairs that can be quantified with at least 3 fragments. e Correlation plot of quantified heavy-endogenous ratios between replicates and input amounts for DIA (left) and hybrid-DIA (right) analysis. Correlation is measured by Pearson. f Boxplots showing the phospho-site ratio distribution between different conditions in DIA (left) and hybrid-DIA (right) analysis. Each plot shows the ratios between replicates of 30 µg of input material, 30 µg vs 20 µg, 30 µg vs 10 µg, 30 µg vs 5 µg and 30 µg vs 2.5 µg. Dark boxplots show the global distribution of all phospho-sites measured using the DIA windows in both methods and analyzed in Spectronaut (i.e: global phosphoproteome). Light boxplots show the distribution of the endogenous/heavy ratios. Center lines show the medians; box limits indicate the 25th and 75th percentiles as determined by R software; whiskers extend 1.5 times the interquartile range from the 25th and 75th percentiles, outliers are represented by dots. N = 2666, 47, 2501, 50, 2153, 46, 1813, 40, 1390, 39,2862, 84, 2450, 77, 2152, 76, 1599, 70, 1160, 63. Source data are provided as a Source Data file.

