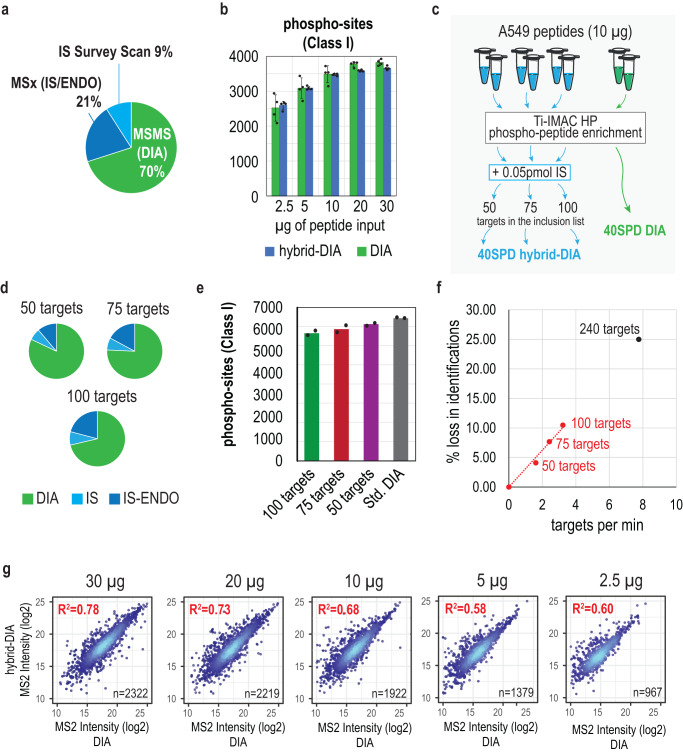
Fig. 4. Evaluation of the depth achieved from DIA data from hybrid-DIA datasets.
a Pie charts representing the proportion of cycle time used by the hybrid-DIA API measured in acquisition time. b Number of phospho-sites (class I) identified using Spectronaut (v17) in DIA (green, n = 4 independent experiments) and hybrid-DIA (blue, n = 4 independent experiments). Length of the bars indicate the average of the experimental replicates, and the error bars the standard deviation. c Experimental design to evaluate the effect of different number of peptides used in the inclusion list during hybrid-DIA analysis. d Pie charts representing the proportion of cycle time used by the hybrid-DIA API measured by acquisition time when using an inclusion list of 50, 75 or 100 targets. In green, the proportion of the total MS2 acquisition time used in DIA scans; in light blue, the time used in survey scans for detecting the presence of the internal standard (IS) and in dark blue, the time used in multiplexed (IS and ENDO peptides). e Barplots showing the number of phospho-sites (class I) identified in either standard DIA runs, or when using hybrid-DIA methods and increasing number of targets. Bar length represents the average of the identified sites between replicates (n = 2). f Relationship between peptides targeted per minute (calculated by dividing the total number of peptides in the inclusion list by the gradient length) against the percentage of lost identifications (using standard DIA values as reference). In black, hypothetical extrapolation of the number of targets that would lead to 25% of lost identifications. g Correlation plot of quantified phospho-sites in hybrid-DIA runs (y-axis) versus DIA runs (x-axis) for the different dilutions. Correlation is indicated as R-squared. IS: heavy-labeled internal standard, IS/ENDO: targeted multiplex scan with internal standard and endogenous peptide. Source data are provided as a Source Data file.

