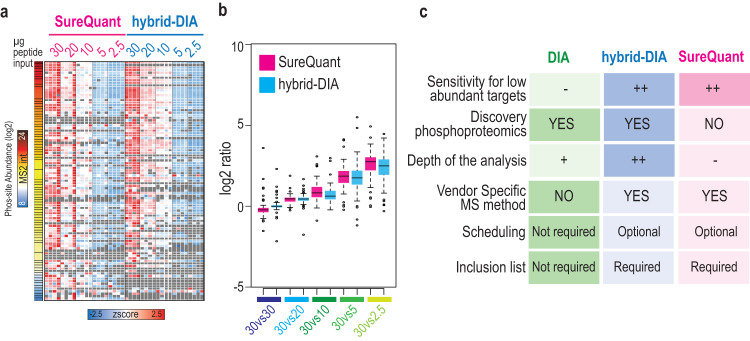
Fig. 5. Benchmark of hybrid-DIA versus SureQuant for sensitive phosphoproteomics analysis.
a Heatmap showing relative quantification of targeted peptides in a dilution series experiment (Fig. 3a) in SureQuant (pink) and hybrid-DIA (blue). Sites are sorted by abundance. b Boxplots showing the phospho-site ratio of targeted peptides (measured as log2 of the ratio ENDO/IS in one amount versus ratio ENDO/IS in 30 µg) in SureQuant (left) and hybrid-DIA (right) analysis. Each plot shows the ratios between replicates of 30 µg of input material, and 30 µg vs 20 µg, 30 µg vs 10 µg, 30 µg vs 5 µg and 30 µg vs 2.5 µg. Center lines show the medians; box limits indicate the 25th and 75th percentiles as determined by R software; whiskers extend 1.5 times the interquartile range from the 25th and 75th percentiles, outliers are represented by dots. N = 80, 84, 82, 77, 79, 76, 76, 70, 72, 63. c Comparative table of characteristics and performance of DIA, hybrid-DIA, and SureQuant based on different aspects of shot-gun and targeted proteomics analysis. Source data are provided as a Source Data file.

