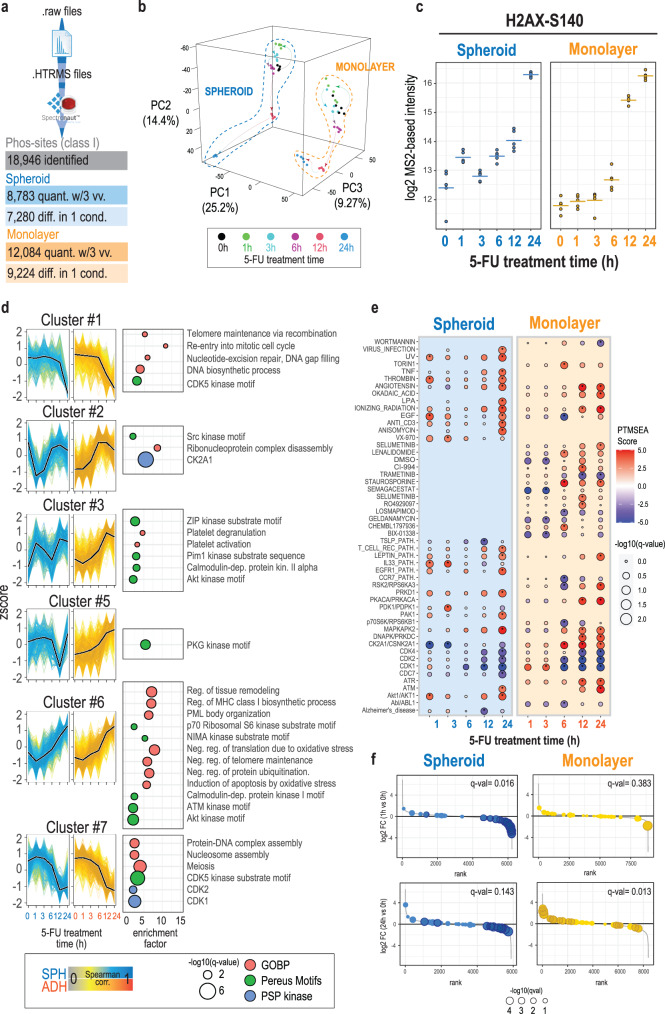
Fig. 8. Discovery phosphoproteomics analysis using hybrid-DIA allows to describe temporal response and kinase activation after 5-fluorouracil treatment in 2D and 3D model.
a Overview of the results obtained from the analysis of the DIA data with Spectronaut, after conversion to HTRMS format. b Principal Component analysis of spheroids and monolayer-grown cells treated with 5-FU at 0, 1, 3, 6, 12, and 24 h (n = biological replicates 5). c Log2 intensity at MS2 level of H2AX Serine 140 (n = biological replicates 5, horizontal lines indicate the average of all measures). d Temporal profiles for relevant clusters (see Supplementary Figure 6C). To the right of each graph, the results from a Fisher’s exact test to show overrepresentation of terms from GOBP, Phosphositeplus Kinases and Kinase motifs. Size of the dot indicates the significance (two-sided, Fisher’s exact test, BH-FDR corrected), position on the x-axis, the enrichment factor, and the color indicates the ontology to which each term belongs. e PTMSEA results. Size of the dot indicates the significance (BH-FDR corrected); color indicates whether the term (associated pathway or kinase) is upregulated (red) or downregulated (blue). f Rank plots showing phospho-sites ranked by their fold change (log2) at 1 or 24 h of treatment versus non-treated samples. Dots indicate the position of phospho-sites from the CK2A1 term (from PTMSEA database). Size of the dot indicates the significance of the fold change (limma robust moderated t-test, two-sided, BH-FDR, n = biological replicates 5). Darker dots highlight the sites with FDR corrected p-value < 0.01. Source data are provided as a Source Data file.

