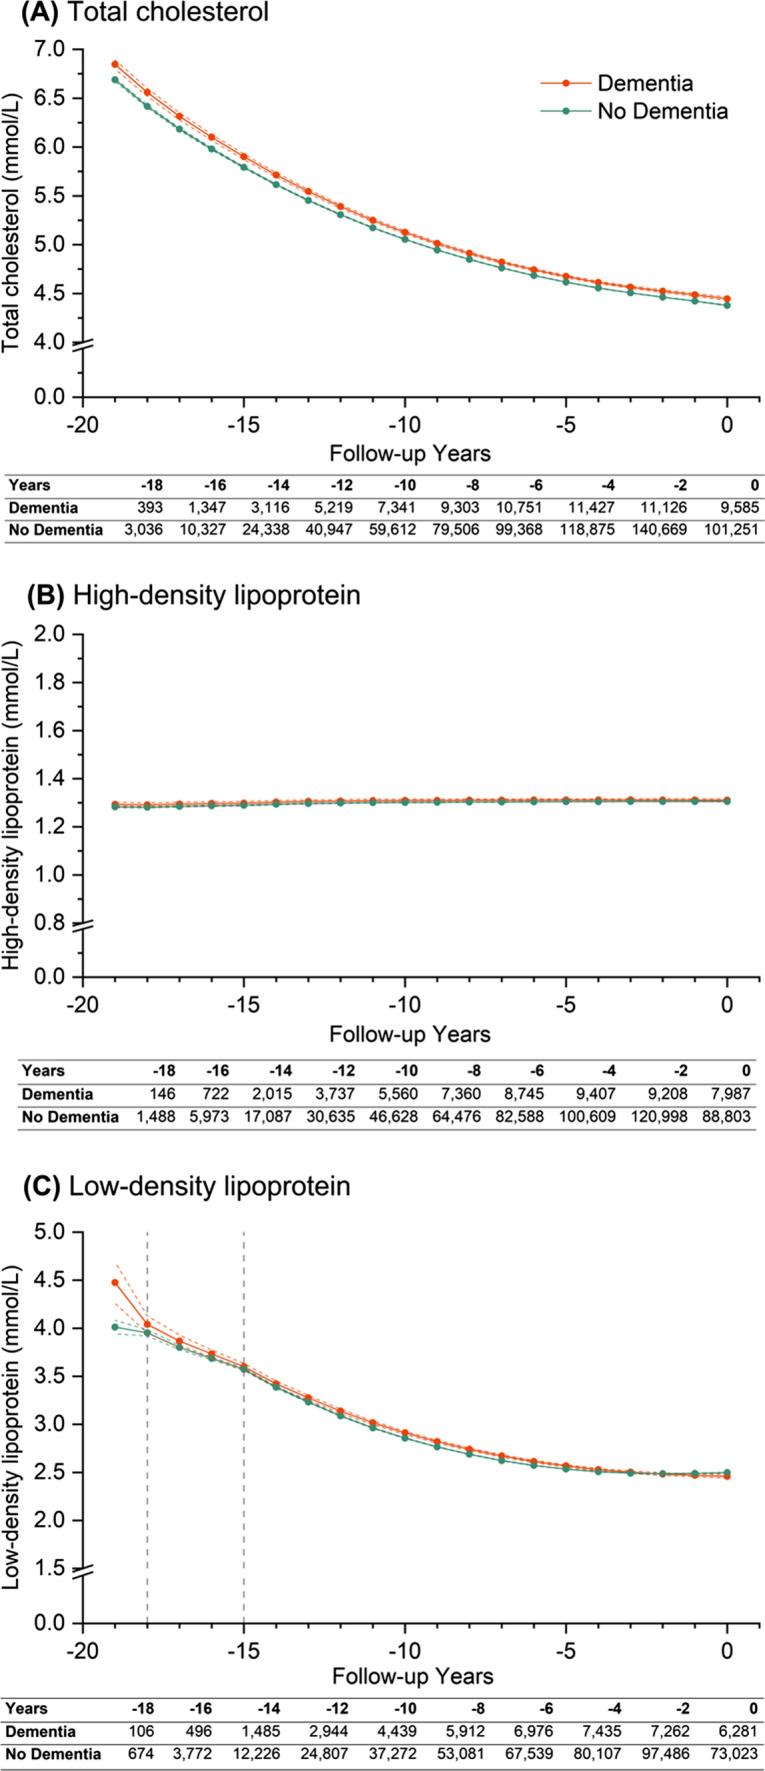
Fig. 3.

Trajectories of (A) cholesterol, (B) high density lipoprotein, and (C) low density lipoprotein over 20 years of retrospective follow-up. Year 0 (zero time point) represents either the date of diagnosis of dementia (dementia group) or last contact with healthcare (non-dementia group). Patients were traced backwards in time, and were allowed to enter the cohort at any time conditional on a diabetes diagnosis within their retrospective follow-up duration. Estimations are based on non-piecewise linear (high-density lipoprotein) or non-linear (total cholesterol), or piecewise non-linear (low-density lipoprotein) growth curve models, including up to three time periods modelled as linear or non-linear splines, dementia status, and interactions between dementia status and time. Coloured solid lines represent point estimates for each group, coloured dotted lines for 95% confidence intervals for said estimations, while modelled time periods are indicted by grey vertical dotted lines. Both total cholesterol and high-density lipoprotein considered time as a single period from 0 to -19 (from right to left), while three time periods ranging from year 0 to − 15, − 15 to − 18, − 18 to − 19 were defined for low-density lipoprotein. Retrospective trajectories are adjusted for baseline covariates including age, sex, ethnicity, smoking status, Index of Multiple Deprivation quintiles, duration of diabetes and their interactions with time, and time-varying covariates including insulin prescription and number of comorbid conditions. Tables underneath each graph report the number of measurements for dementia and non-dementia group at each stated retrospective follow-up year, where year 0 is the study baseline
