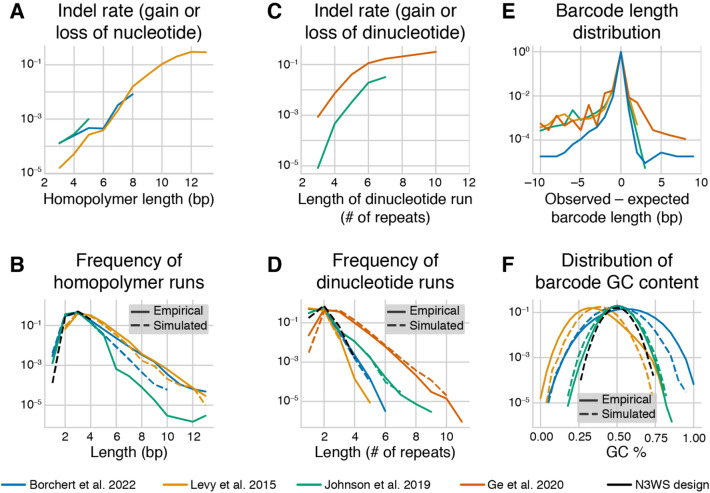
Fig. 2.
Barcode design features and error rates. (A) The total indel error rate in homopolymer runs, estimated from barcode data in the datasets indicated in the legend. Barcode designs are shown in Fig. 1 and Table S1. (B) The frequency of homopolymer runs of different lengths in the empirical and simulated datasets of barcodes with different designs (see Methods for details). (C) The total indel error rate in dinucleotide runs, estimated from barcode data. (D) The frequency of dinucleotide runs of different lengths in the empirical and simulated datasets of barcodes with different designs. (E) The empirical distributions of barcode lengths, putatively due to variation in the true length of barcodes (see Methods for details). (F) The distributions of GC content in barcodes in the empirical and simulated datasets (Color figure online)

