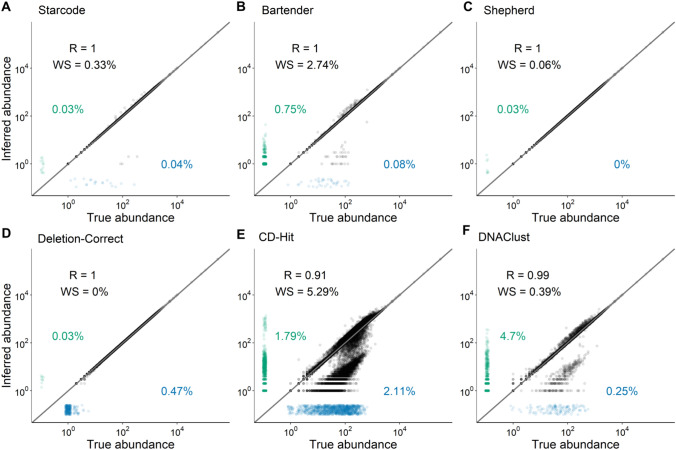
Fig. 4.
Comparison of error-correction methods. We tested six published error-correction methods on a simulated barcode dataset (see “Identifying barcodes in sequencing data” section and Methods for details). The true abundance of each barcode (x-axis) is shown against the inferred abundance of the barcode most closely associated with it after error correction (y-axis). “R” is the Pearson correlation coefficient of log-transformed data for the successfully inferred barcodes. “WS” is the fraction of barcodes where a wrong sequence was inferred by the error-correction method (see text). Blue points along the x-axis show false negatives, i.e., true barcodes that were not identified (numbers show percentages). Green points along the y-axis show false positives, i.e., identified barcodes that are not associated with a true barcode (numbers show percentages). The gray line is the diagonal y = x (Color figure online)

